Sedgwick: Fire Incidents, Kansas (KS)
Where are fire incidents reported in Sedgwick, KS
Something went wrong! Please refresh the page.
|
| |||||||||||||||||||||||||||||||||||||||||||||||||||||||||||||||||||||||||||||||||||||||||||||||||||||||||||||
2002 - 2018 National Fire Incident Reporting System (NFIRS) incidents
- Incident types reported to NFIRS in Sedgwick, KS
- 80155.0%Rescue & EMS
- 35024.0%Fire
- 17211.8%Good Intent Call
- 684.7%Hazardous Condition
- 463.2%Service Call
- 141.0%False Alarm
- 40.3%Special Incident
- Fire incident types reported to NFIRS in Sedgwick, KS
- 22865.1%Outside Fires
- 7922.6%Structure Fires
- 3810.9%Mobile Property/Vehicle Fires
- 51.4%Other
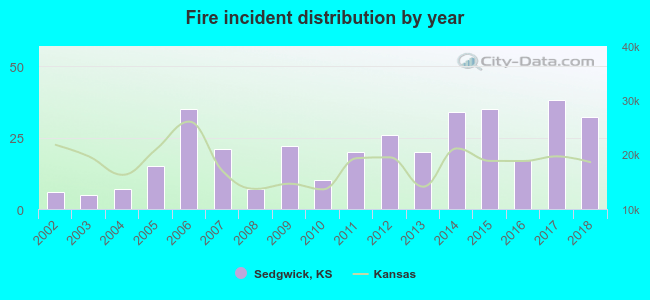 Based on the data from the years 2002 - 2018 the average number of fire incidents per year is 21. The highest number of fires - 38 took place in 2017, and the least - 5 in 2003. The data has an increasing trend.
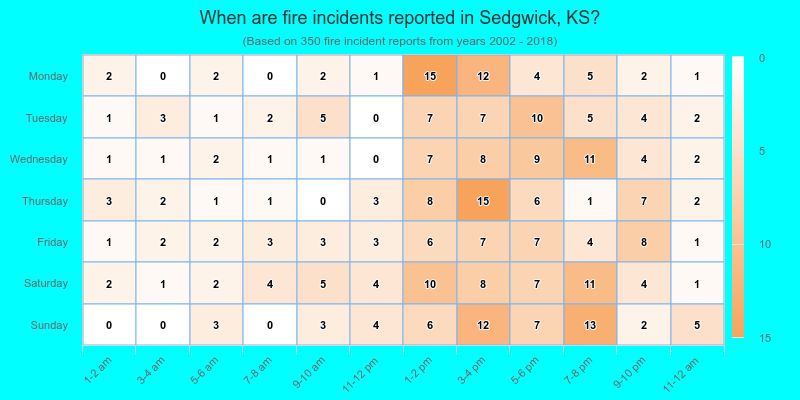
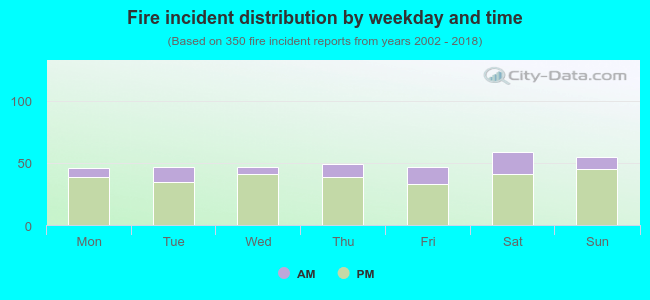 22.0% incidents where reported in the morning and 78.0% in the evening. The most fires (16.9%) took place on Saturday, and the least (13.1%) on Monday.
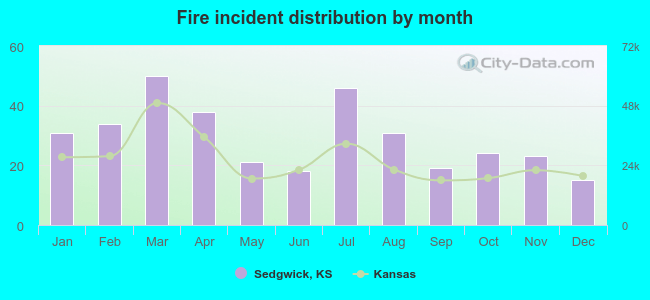 According to the 350 incident reports from years 2002 - 2018 most fires (14.3%) took place during March, and the least (4.3%) in December.
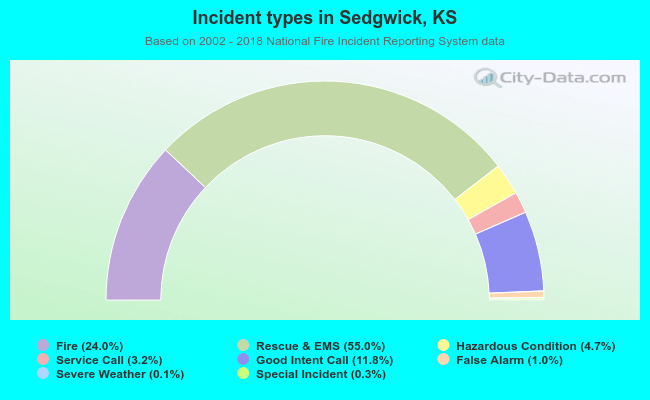 Out of all 1,456 cases reported during the years 2002 - 2018, the most belonged to the categories: Overpressure Rupture (55.0%), Fire (24.0%), and Service Call (11.8%).
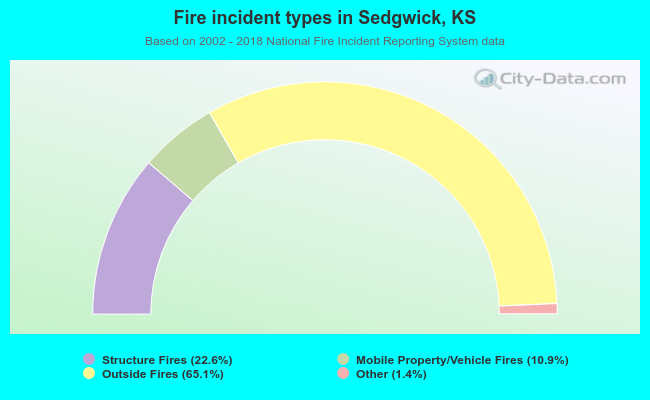 When looking into fire subcategories, the most reports belonged to: Outside Fires (65.1%), and Structure Fires (22.6%).