Sellersville: Fire Incidents, Pennsylvania (PA)
Where are fire incidents reported in Sellersville, PA
Something went wrong! Please refresh the page.
|
| |||||||||||||||||||||||||||||||||||||||||||||||||||||||||||||||||||||||||||||||||||||||||||||||||||||||||||||
2003 - 2018 National Fire Incident Reporting System (NFIRS) incidents
- Incident types reported to NFIRS in Sellersville, PA
- 47335.1%Fire
- 26920.0%Hazardous Condition
- 16412.2%Rescue & EMS
- 15811.7%Good Intent Call
- 14510.8%False Alarm
- 1017.5%Service Call
- 322.4%Special Incident
- 40.3%Overpressure Rupture
- Fire incident types reported to NFIRS in Sellersville, PA
- 31165.8%Structure Fires
- 10121.4%Outside Fires
- 357.4%Mobile Property/Vehicle Fires
- 265.5%Other
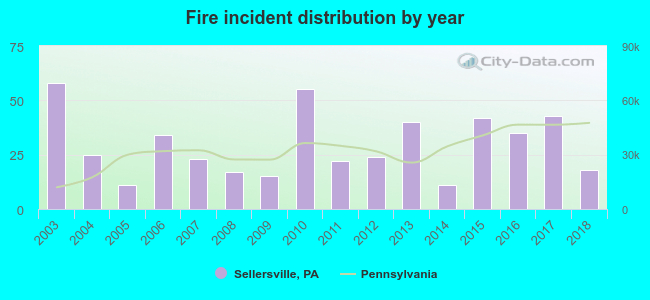 According to the data from the years 2003 - 2018 the average number of fire incidents per year is 30. The highest number of fires - 58 took place in 2003, and the least - 11 in 2005. The data has a decreasing trend.
 37.6% incidents where reported in the morning and 62.4% in the evening. The most fires (17.8%) took place on Friday, and the least (12.1%) on Sunday.
 According to the 473 fire incident reports from years 2003 - 2018 most fires (12.1%) took place during April, and the least (4.2%) in June.
 Out of all 1,346 cases reported during the years 2003 - 2018, the most belonged to the categories: Fire (35.1%), Hazardous Condition (20.0%), and Rescue & EMS (12.2%).
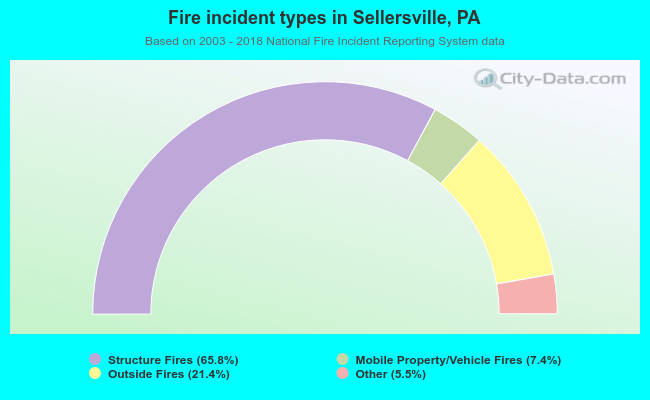 When looking into fire subcategories, the most incidents belonged to: Structure Fires (65.8%), and Outside Fires (21.4%).