| Fire incidents reported |
|---|
| Sreet name | Count |
|---|
| 1478 96TH ROAD | 6 | | 709 NEMAHA | 6 | | 111 NORTH STREET | 4 | | 11TH STREET | 4 | | 128TH I RD | 4 | | 136TH H RD | 4 | | 1600 112TH RD | 4 | | 1ST STREET | 4 | | 2 12 MLS EAST ON 36 | 4 | | 36 63 | 4 | | 36 MRD | 4 | | 500 MADISON ST | 4 | | 512 COMMUNITY DRIVE | 4 | | HWY 63 96TH RD | 4 | | HWY36 144TH RD | 4 | | NORTH 7TH | 4 | | 1 12 MILES SOUTH ON 63 | 2 | | 1 MILE S ON J RD | 2 | | 1/4 MIULE EAST OF ONEIDA | 2 | | 103 HIWAY 36 | 2 | | 1050 96TH RD | 2 | | 111 N 1ST STREET | 2 | | 112 NILES NORTH OF 36 OD | 2 | | 112TH J RD | 2 | | 1158 HWY 36 | 2 |
| | | Fire incidents reported |
|---|
| Sreet name | Count |
|---|
| 116 EAST MAIN | 2 | | 1181 US HWY 36 | 2 | | 12 ML N 120TH J RD | 2 | | 12 ML WEST OF J ON 128TH | 2 | | 120 EAST HWY 36 | 2 | | 120TH 187 HWY | 2 | | 120TH AND P ROAD | 2 | | 120TH BETWEEN M RD AND ND | 2 | | 1229 120TH RD | 2 | | 126 WALNUT IN BAILEYVILLE | 2 | | 1264 HIWAY 36 | 2 | | 1273 116TH RD | 2 | | 128TH Q RD | 2 | | 128TH R RD | 2 | | 12TH ROANOKE | 2 | | 1326 M4 RD | 2 | | 132ND AND H RD | 2 | | 132ND M RD | 2 | | 1334 96TH RD | 2 | | 1354 HIWAY 36 | 2 | | 136 AND D ROAD | 2 | | 14 EAST OF 192ND RD | 2 | | 1405 PONY EXPRESS TRAIL | 2 | | 1406 144TH RD | 2 | | |
|
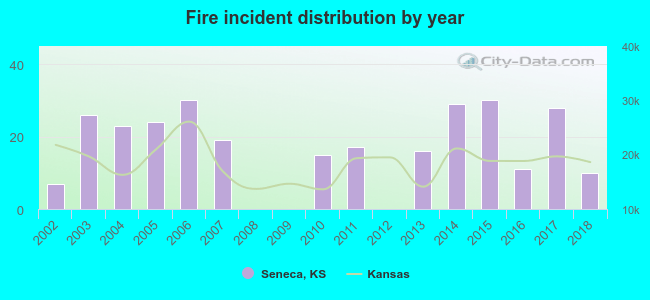 Based on the data from the years 2002 - 2018 the average number of fire incidents per year is 17. The highest number of fires - 30 took place in 2006, and the least - 0 in 2008. The data has an increasing trend.
 27.0% incidents where reported in the morning and 73.0% in the evening. The most fires (16.1%) took place on Tuesday, and the least (11.6%) on Monday.
 According to the 285 incident reports from years 2002 - 2018 most fires (18.9%) took place during March, and the least (4.6%) in December.
 Out of all 415 cases reported during the years 2002 - 2018, the most belonged to the categories: Fire (68.7%), Rescue & EMS (15.9%), and False Alarm (4.8%).
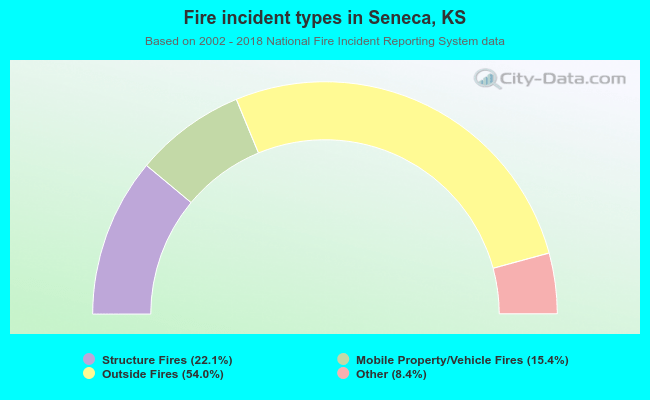 When looking into fire subcategories, the most reports belonged to: Outside Fires (54.0%), and Structure Fires (22.1%).