| Fire incidents reported |
|---|
| Sreet name | Count |
|---|
| GLATFELTERS STATION RD | 32 | | CHURCH ST | 30 | | SEVEN VALLEYS RD | 28 | | SHAFFERS CHURCH RD | 26 | | GREEN VALLEY RD | 24 | | MAIN ST | 20 | | LARUE RD | 16 | | SEITZVILLE RD | 16 | | JUNCTION RD | 14 | | LOOP RD | 14 | | ROHRBAUGH RD | 14 | | ZEIGLERS CHURCH RD | 14 | | CHERRY ST | 12 | | HOKE RD | 12 | | REYNOLDS MILL RD | 12 | | YELLOW CHURCH RD | 12 | | TUNNEL HILL RD | 10 | | WALTERS HATCHERY RD | 10 | | ALDINGER RD | 8 | | BRIGHTON CIR | 8 | | GROTHEY RD | 8 | | HOFF RD | 8 | | MAPLE ST | 8 | | MESSERSMITH RD | 8 | | NOSS RD | 8 |
| | | Fire incidents reported |
|---|
| Sreet name | Count |
|---|
| SEAKS RUN RD | 8 | | SPRING RD | 8 | | CEMETERY RD | 6 | | EDWARDS LA | 6 | | INTERSTATE I83 SB | 6 | | MELVIN LA | 6 | | OAKWOOD DR | 6 | | ROUTE 616 RT | 6 | | SEVEN VALLEYS RDS | 6 | | SOUTH RD | 6 | | UNION CHURCH RD | 6 | | BAUGHMAN LA | 4 | | BEARDS SCHOOL RD | 4 | | CATHOLIC VALLEY RD | 4 | | DUNKARD VALLEY RD | 4 | | GLATFELTER STATION RD | 4 | | GROVE LA | 4 | | HILLCLIMB RD | 4 | | REYNOLDS MILL | 4 | | ROCKVILLE RD | 4 | | SOUTH ST | 4 | | SUSQUEHANNA TRL | 4 | | WHISPERING SPRINGS DR | 4 | | 3964 N ROHRBAUGH | 2 | | |
|
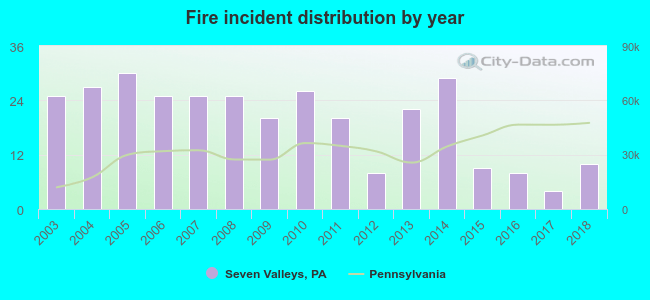 According to the data from the years 2003 - 2018 the average number of fire incidents per year is 20. The highest number of fires - 30 took place in 2005, and the least - 4 in 2017. The data has a decreasing trend.
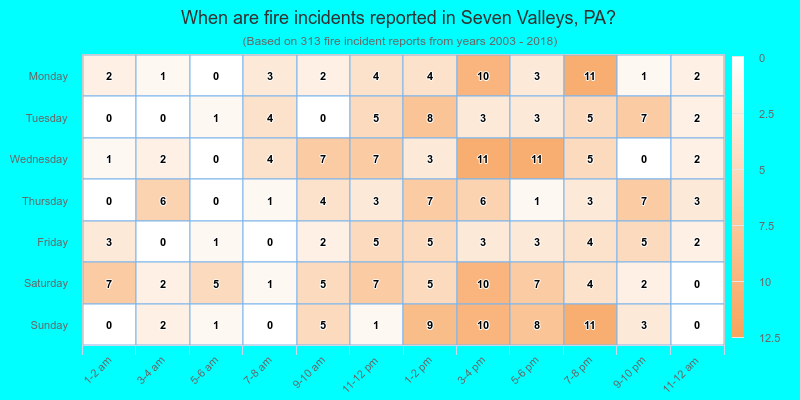
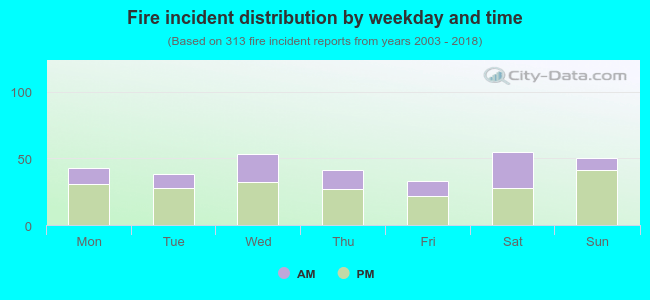 33.2% incidents where reported in the morning and 66.8% in the evening. The most fires (17.6%) took place on Saturday, and the least (10.5%) on Friday.
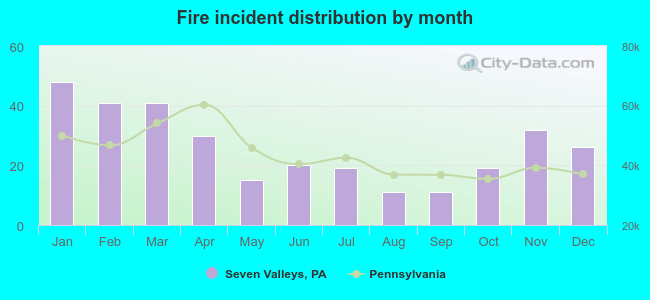 According to the 313 fire incident reports from years 2003 - 2018 most fires (15.3%) took place during January, and the least (3.5%) in August.
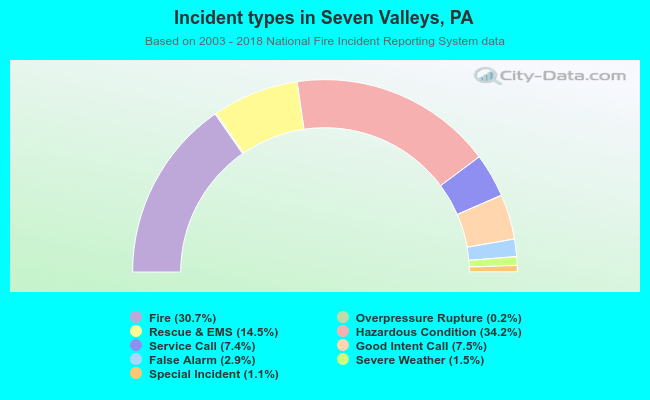 Out of all 1,020 cases reported during the years 2003 - 2018, the most belonged to the categories: Hazardous Condition (34.2%), Fire (30.7%), and Rescue & EMS (14.5%).
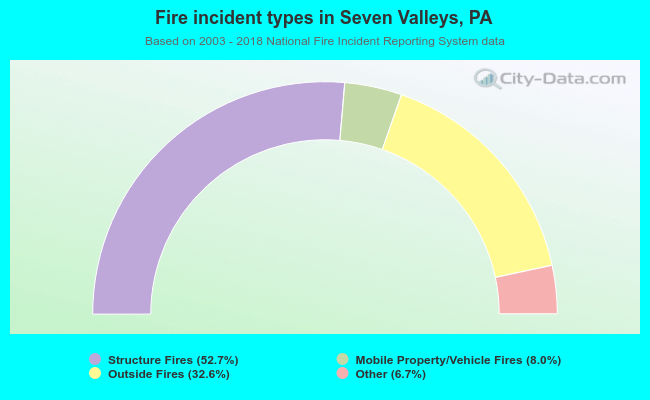 When looking into fire subcategories, the most incidents belonged to: Structure Fires (52.7%), and Outside Fires (32.6%).