Seward: Fire Incidents, Alaska (AK)
Where are fire incidents reported in Seward, AK
Something went wrong! Please refresh the page.
|
| |||||||||||||||||||||||||||||||||||||||||||||||||||||||||||||||||||||||||||||||||||||||||||||||||||||||||||||
| Other | 16 | |||||||||||||||||||||||||||||||||||||||||||||||||||||||||||||||||||||||||||||||||||||||||||||||||||||||||||||
2002 - 2018 National Fire Incident Reporting System (NFIRS) incidents
- Incident types reported to NFIRS in Seward, AK
- 1,31643.7%Rescue & EMS
- 49016.3%Fire
- 34211.4%Good Intent Call
- 30610.2%False Alarm
- 2789.2%Service Call
- 2528.4%Hazardous Condition
- 130.4%Severe Weather
- 70.2%Special Incident
- 50.2%Overpressure Rupture
- Fire incident types reported to NFIRS in Seward, AK
- 24850.6%Structure Fires
- 14028.6%Outside Fires
- 9018.4%Mobile Property/Vehicle Fires
- 122.4%Other
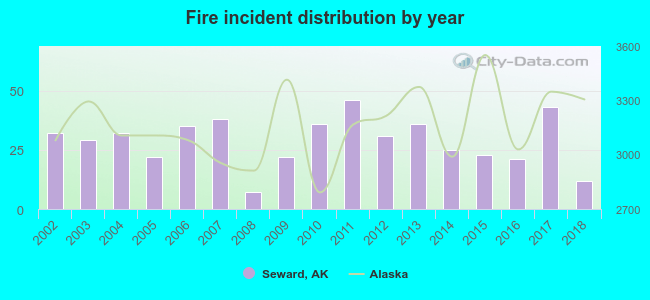 Based on the data from the years 2002 - 2018 the average number of fire incidents per year is 29. The highest number of reported fires - 46 took place in 2011, and the least - 7 in 2008. The data has a decreasing trend.
 Based on the data from the years 2002 - 2018 the average number of fire-related yearly deaths is 0. The highest number of reported deaths - 1 took place in 2006, and the lowest - 0 in 2002. The data has a constant trend.
 Based on the data from the years 2002 - 2018 the average number of fire-related yearly casualties is 0. The highest number of reported casualties - 1 took place in 2006, and the lowest - 0 in 2002. The data has a constant trend.
 38.2% incidents where reported in the morning and 61.8% in the evening. The most fires (16.3%) took place on Thursday, and the least (13.3%) on Friday.
 Based on the 490 fires from years 2002 - 2018 most fires (13.7%) took place during July, and the least (4.7%) in December.
 Out of all 3,009 cases reported during the years 2002 - 2018, the most belonged to the categories: Rescue & EMS (43.7%), Fire (16.3%), and Good Intent Call (11.4%).
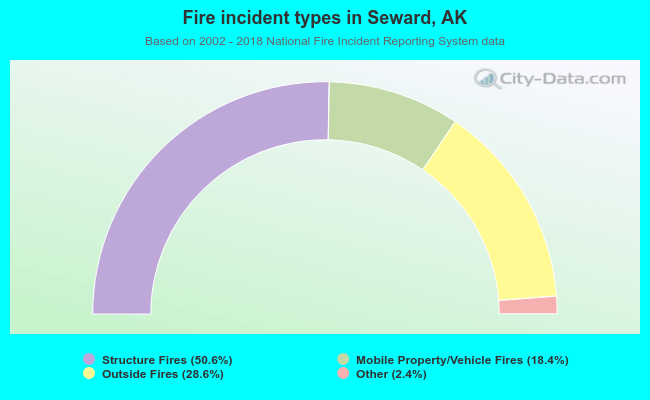 When looking into fire subcategories, the most incidents belonged to: Structure Fires (50.6%), and Outside Fires (28.6%).