Shady Cove: Fire Incidents, Oregon (OR)
Where are fire incidents reported in Shady Cove, OR
Something went wrong! Please refresh the page.
|
| |||||||||||||||||||||||||||||||||||||||||||||||||||||||||||||||||||||||||||||||||||||||||||||||||||||||||||||
2002 - 2018 National Fire Incident Reporting System (NFIRS) incidents
- Incident types reported to NFIRS in Shady Cove, OR
- 1,39466.4%Rescue & EMS
- 25212.0%Service Call
- 21210.1%Fire
- 1798.5%Good Intent Call
- 271.3%Hazardous Condition
- 231.1%False Alarm
- 50.2%Severe Weather
- 50.2%Special Incident
- Fire incident types reported to NFIRS in Shady Cove, OR
- 9745.8%Structure Fires
- 9343.9%Outside Fires
- 146.6%Mobile Property/Vehicle Fires
- 83.8%Other
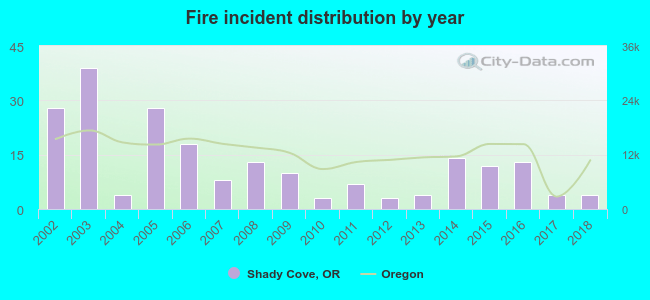 According to the data from the years 2002 - 2018 the average number of fires per year is 12. The highest number of reported fire incidents - 39 took place in 2003, and the least - 3 in 2010. The data has a dropping trend.
 28.3% incidents where reported in the morning and 71.7% in the evening. The most fires (19.3%) took place on Friday, and the least (10.4%) on Monday.
 According to the 212 fire incidents from years 2002 - 2018 most fires (18.4%) took place during July, and the least (3.8%) in February.
 Out of all 2,098 cases reported during the years 2002 - 2018, the most belonged to the categories: Rescue & EMS (66.4%), Service Call (12.0%), and Fire (10.1%).
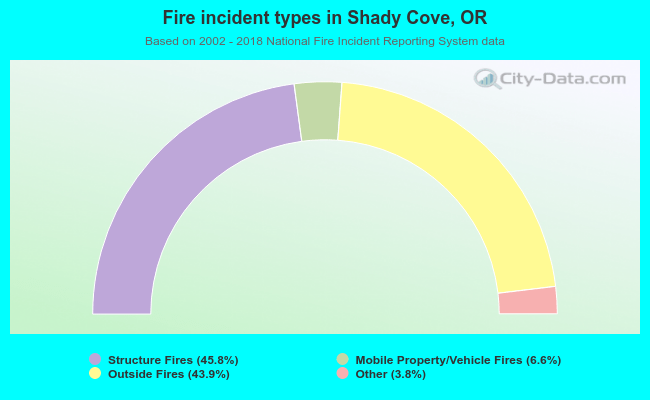 When looking into fire subcategories, the most incidents belonged to: Structure Fires (45.8%), and Outside Fires (43.9%).