Shady Shores: Fire Incidents, Texas (TX)
Where are fire incidents reported in Shady Shores, TX
Something went wrong! Please refresh the page.
|
| |||||||||||||||||||||||||||||||||||||||||||||||||||||||||||||||||||||||||||||||||||||||||||||||||
2002 - 2018 National Fire Incident Reporting System (NFIRS) incidents
- Incident types reported to NFIRS in Shady Shores, TX
- 41841.6%Rescue & EMS
- 19018.9%Service Call
- 13012.9%Good Intent Call
- 10310.2%Fire
- 888.8%Hazardous Condition
- 707.0%False Alarm
- 20.2%Overpressure Rupture
- 20.2%Severe Weather
- 20.2%Special Incident
- Fire incident types reported to NFIRS in Shady Shores, TX
- 5553.4%Outside Fires
- 3534.0%Structure Fires
- 87.8%Mobile Property/Vehicle Fires
- 54.9%Other
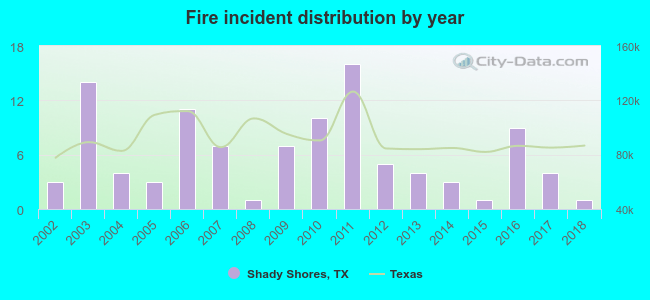 Based on the data from the years 2002 - 2018 the average number of fires per year is 6. The highest number of fire incidents - 16 took place in 2011, and the least - 1 in 2008. The data has a dropping trend.
 26.2% incidents where reported in the morning and 73.8% in the evening. The most fires (20.4%) took place on Monday, and the least (5.8%) on Wednesday.
 Based on the 103 fire incidents from years 2002 - 2018 most fires (15.5%) took place during February, and the least (1.9%) in June.
 Out of all 1,005 cases reported during the years 2002 - 2018, the most belonged to the categories: Rescue & EMS (41.6%), Service Call (18.9%), and Good Intent Call (12.9%).
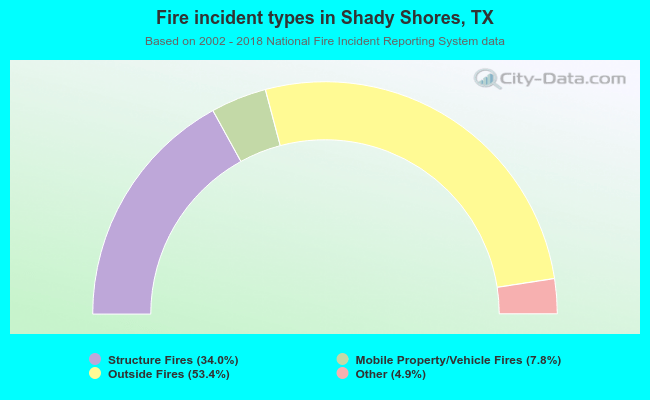 When looking into fire subcategories, the most incidents belonged to: Outside Fires (53.4%), and Structure Fires (34.0%).