Sharpsville: Fire Incidents, Indiana (IN)
Where are fire incidents reported in Sharpsville, IN
Something went wrong! Please refresh the page.
|
| |||||||||||||||||||||||||||||||||||||||||||||||||||||||||||||||||||||||||||||||||||||||||||||||||||||||||||||
| Other | 31 | |||||||||||||||||||||||||||||||||||||||||||||||||||||||||||||||||||||||||||||||||||||||||||||||||||||||||||||
2002 - 2018 National Fire Incident Reporting System (NFIRS) incidents
- Incident types reported to NFIRS in Sharpsville, IN
- 26840.2%Rescue & EMS
- 19729.5%Fire
- 9213.8%Good Intent Call
- 8412.6%Hazardous Condition
- 192.8%Service Call
- 71.0%False Alarm
- Fire incident types reported to NFIRS in Sharpsville, IN
- 9447.7%Outside Fires
- 8342.1%Structure Fires
- 147.1%Mobile Property/Vehicle Fires
- 63.0%Other
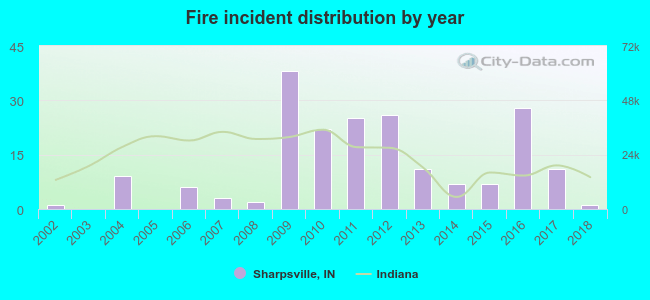 Based on the data from the years 2002 - 2018 the average number of fire incidents per year is 12. The highest number of reported fires - 38 took place in 2009, and the least - 0 in 2003. The data has a constant trend.
 33.0% incidents where reported in the morning and 67.0% in the evening. The most fires (16.2%) took place on Monday, and the least (11.2%) on Thursday.
 According to the 197 fire incident reports from years 2002 - 2018 most fires (15.7%) took place during March, and the least (3.6%) in February.
 Out of all 667 cases reported during the years 2002 - 2018, the most belonged to the categories: Overpressure Rupture (40.2%), Fire (29.5%), and Service Call (13.8%).
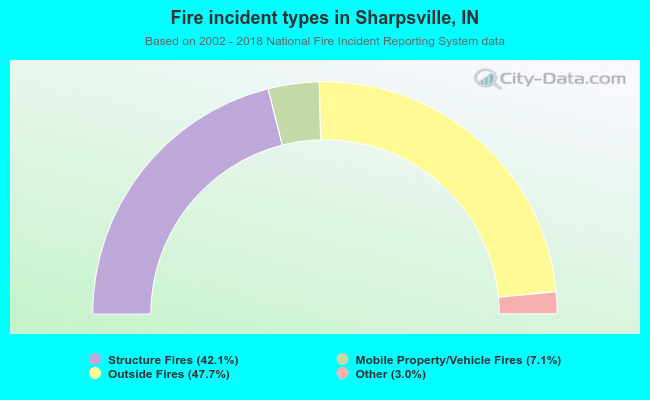 When looking into fire subcategories, the most incidents belonged to: Outside Fires (47.7%), and Structure Fires (42.1%).