Shelburn: Fire Incidents, Indiana (IN)
Where are fire incidents reported in Shelburn, IN
Something went wrong! Please refresh the page.
|
| |||||||||||||||||||||||||||||||||||||||||||||||||||||||||||||||||||||||||||||||||||||||||||||||||||||||||||||
2003 - 2017 National Fire Incident Reporting System (NFIRS) incidents
- Incident types reported to NFIRS in Shelburn, IN
- 42365.5%Fire
- 11017.0%Rescue & EMS
- 6910.7%Hazardous Condition
- 162.5%Good Intent Call
- 111.7%Special Incident
- 101.5%Service Call
- 40.6%False Alarm
- 30.5%Severe Weather
- Fire incident types reported to NFIRS in Shelburn, IN
- 19746.6%Outside Fires
- 15235.9%Structure Fires
- 5212.3%Mobile Property/Vehicle Fires
- 225.2%Other
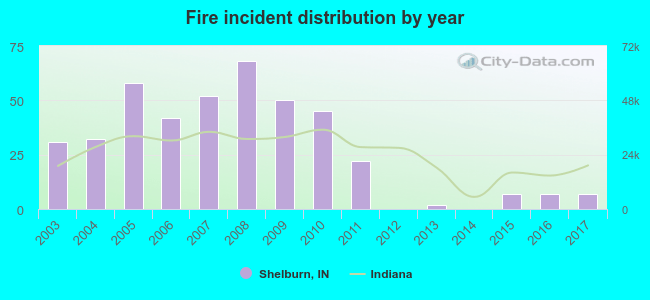 Based on the data from the years 2003 - 2017 the average number of fire incidents per year is 28. The highest number of reported fires - 68 took place in 2008, and the least - 0 in 2012. The data has a dropping trend.
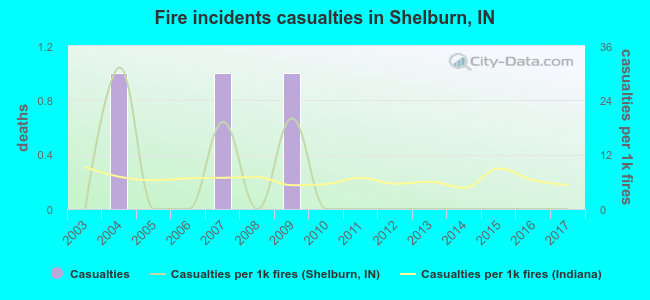 Based on the data from the years 2003 - 2017 the average number of fire-related casualties per year is 0. The highest number of reported casualties - 1 took place in 2004, and the lowest - 0 in 2003. The data has a constant trend.
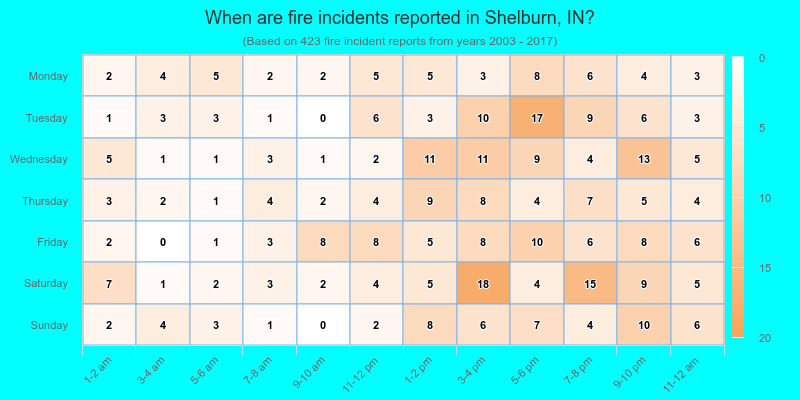
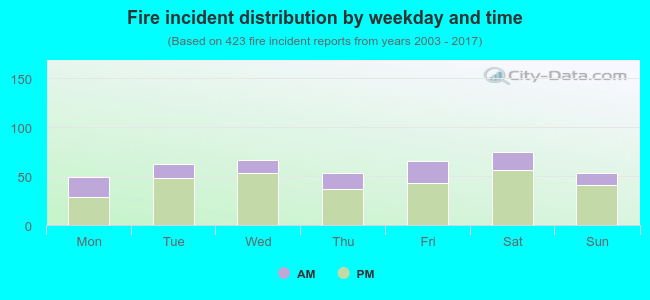 27.4% incidents where reported in the morning and 72.6% in the evening. The most fires (17.7%) took place on Saturday, and the least (11.6%) on Monday.
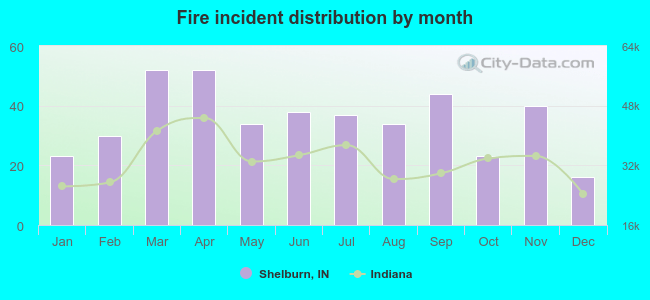 According to the 423 reports from years 2003 - 2017 most fires (12.3%) took place during March, and the least (3.8%) in December.
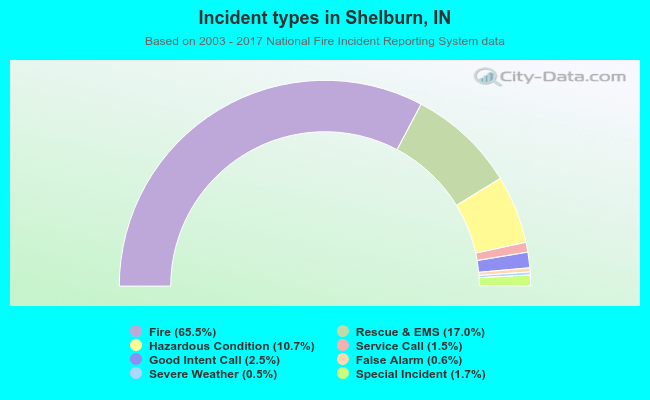 Out of all 646 cases reported during the years 2003 - 2017, the most belonged to the categories: Fire (65.5%), Overpressure Rupture (17.0%), and Rescue & EMS (10.7%).
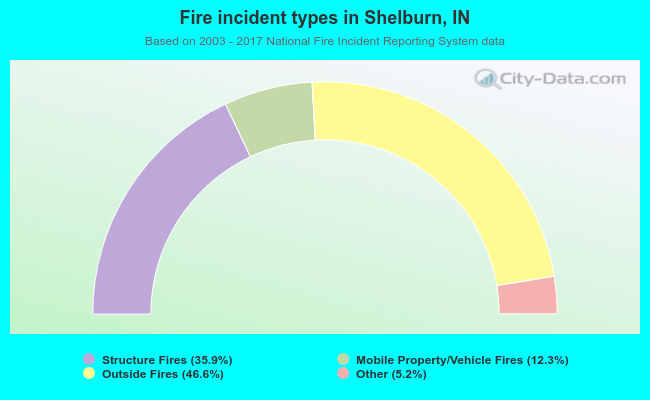 When looking into fire subcategories, the most reports belonged to: Outside Fires (46.6%), and Structure Fires (35.9%).