Shelter Island: Fire Incidents, New York (NY)
Where are fire incidents reported in Shelter Island, NY
Something went wrong! Please refresh the page.
|
| |||||||||||||||||||||||||||||||||||||||||||||||||||||||||||||||||||||||||||||||||||||||||||||||||||||||||||||
2002 - 2018 National Fire Incident Reporting System (NFIRS) incidents
- Incident types reported to NFIRS in Shelter Island, NY
- 35941.5%False Alarm
- 23026.6%Hazardous Condition
- 13115.1%Fire
- 9310.7%Good Intent Call
- 323.7%Service Call
- 161.8%Rescue & EMS
- 30.3%Special Incident
- 20.2%Overpressure Rupture
- Fire incident types reported to NFIRS in Shelter Island, NY
- 5138.9%Structure Fires
- 4836.6%Outside Fires
- 2720.6%Mobile Property/Vehicle Fires
- 53.8%Other
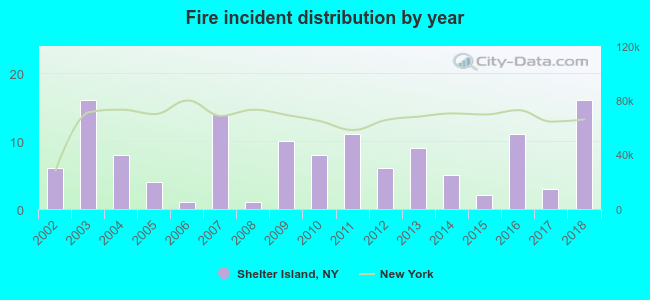 Based on the data from the years 2002 - 2018 the average number of fire incidents per year is 8. The highest number of fires - 16 took place in 2003, and the least - 1 in 2006. The data has a growing trend.
 25.2% incidents where reported in the morning and 74.8% in the evening. The most fires (20.6%) took place on Saturday, and the least (11.5%) on Friday.
 Based on the 131 reports from years 2002 - 2018 most fires (13.7%) took place during January, and the least (2.3%) in October.
 Out of all 866 cases reported during the years 2002 - 2018, the most belonged to the categories: False Alarm (41.5%), Hazardous Condition (26.6%), and Fire (15.1%).
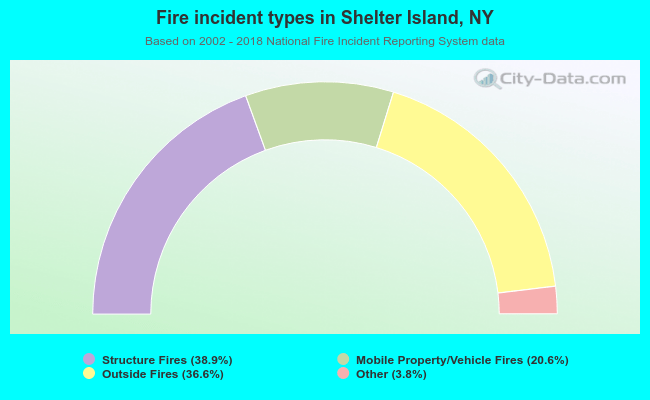 When looking into fire subcategories, the most incidents belonged to: Structure Fires (38.9%), and Outside Fires (36.6%).