| Fire incidents reported |
|---|
| Sreet name | Count |
|---|
| STATE HWY 80 | 46 | | STATE HWY 12 | 34 | | PLEASANT VALLEY RD | 30 | | COUNTY RD 24 | 24 | | FURMAN MILLS RD | 18 | | S MAIN ST | 16 | | BLANDING RD | 14 | | STATE HWY 12B | 14 | | COUNTY RD 23 | 12 | | N MAIN ST | 12 | | SEARS POND RD | 10 | | SPINNERS CT | 10 | | CLASSIC ST | 8 | | CUNNINGHAMLAWRENCE RD | 8 | | GRANVILLE HILL-HARDSCRABB | 8 | | MALTZENSHERIDAN RD | 8 | | S MULLIGAN RD | 8 | | SCHOOL ST | 8 | | BINGHAM RD | 6 | | BINGHAMCOLLINS RD | 6 | | E STATE ST | 6 | | FARLEY RD | 6 | | GRANVILLE HILLHARDSCRABB | 6 | | NEW ST | 6 | | ROBINSON RD | 6 |
| | | Fire incidents reported |
|---|
| Sreet name | Count |
|---|
| WALES RD | 6 | | WEST STATE STREET | 6 | | 29 WEST STATE ST | 4 | | 361 EAST HILL RD. | 4 | | COUNTY ROAD 24 | 4 | | GRANVILLE HILLHARDSCRABB RD | 4 | | HANDSOME BROOK CT | 4 | | JOSH WEBB LN | 4 | | N MAIN | 4 | | NEW TURNPIKE ROAD | 4 | | NORTH RD | 4 | | ROBISON RD | 4 | | RT 12 SOUTH | 4 | | SHERBURNE MOBILE | 4 | | W HILL RD | 4 | | 118 HANSOME BROOK ESTATES | 2 | | 12 KNAPP ST | 2 | | 135 BINGHAM COLLINS ROAD | 2 | | 150 NORTH ROAD | 2 | | 154 KENDRICK RD. | 2 | | 162 WINTON ROAD | 2 | | 169 WILLIAMS RD | 2 | | 18 EAST STATE ST. | 2 | | 187 CUNNINGHAM LAWRENCE RD | 2 | | |
|
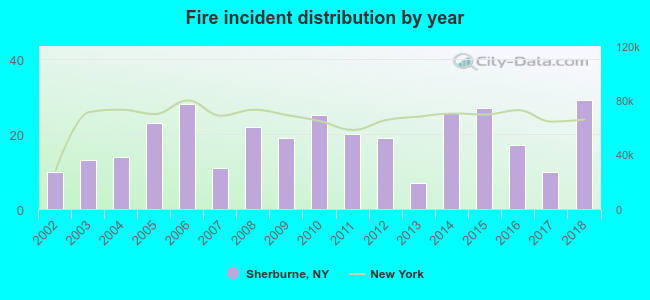 Based on the data from the years 2002 - 2018 the average number of fire incidents per year is 19. The highest number of fires - 29 took place in 2018, and the least - 7 in 2013. The data has a growing trend.
 Based on the reports from the years 2002 - 2018 the average number of fire-related casualties per year is 0. The highest number of reported casualties - 2 took place in 2015, and the lowest - 0 in 2002. The data has a constant trend.
 35.0% incidents where reported in the morning and 65.0% in the evening. The most fires (18.1%) took place on Monday, and the least (8.1%) on Sunday.
 According to the 320 fire incident reports from years 2002 - 2018 most fires (12.8%) took place during April, and the least (1.3%) in October.
 Out of all 2,553 cases reported during the years 2002 - 2018, the most belonged to the categories: Rescue & EMS (65.9%), Fire (12.5%), and Hazardous Condition (7.3%).
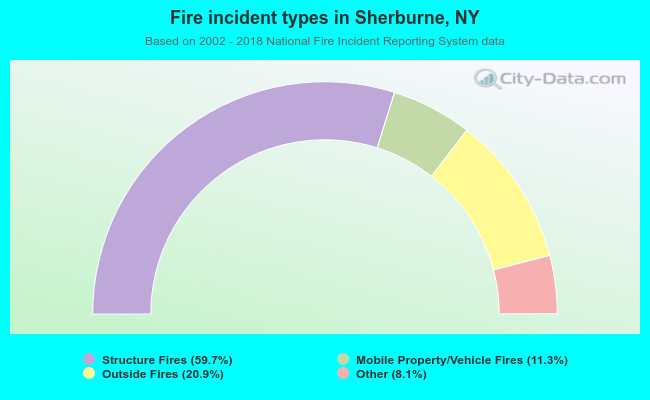 When looking into fire subcategories, the most reports belonged to: Structure Fires (59.7%), and Outside Fires (20.9%).