| Fire incidents reported |
|---|
| Sreet name | Count |
|---|
| RIVER ROAD | 12 | | GRADED RD | 10 | | US 50 WEST | 10 | | HIGHWAY 150 | 8 | | HIGHWAY 50 HWY | 8 | | CHICKEN FARM RD | 6 | | HWY 450 | 6 | | IRONTON RD | 6 | | POWELL VALLEY RD | 6 | | SPOUT SPRINGS ROAD | 6 | | STATE RD 450 | 6 | | US 50 EAST | 6 | | WEST RIVER RD | 6 | | 10880 BOYD HOLLOW RD | 4 | | 12550 CHICKEN FARM RD | 4 | | 13509 CHICKEN FARM ROAD | 4 | | 14032 DOVER HILL RD | 4 | | 14122 RAMEY DYE RD | 4 | | 530 MAIN ST | 4 | | 7886 US 150 | 4 | | 9345 MILL RD | 4 | | ANDERSON RD | 4 | | BOYD HOLLOW RD | 4 | | BUTLER BRIDGE RD | 4 | | CO RD 59 | 4 |
| | | Fire incidents reported |
|---|
| Sreet name | Count |
|---|
| DOVER HILL GATE RD | 4 | | HIGHWAY550 | 4 | | LOW ST | 4 | | R R#1 SHOALS | 4 | | RAILROAD ST | 4 | | RUSK ROAD | 4 | | SHERFICK SCHOOL RD | 4 | | STEVENS RD | 4 | | US 450 | 4 | | US 650 | 4 | | WINDOM RD | 4 | | 10084 MILL ROAD | 2 | | 105 WATER ST | 2 | | 10592 SHERFICK SCHOOL RD | 2 | | 10705 BOYD HOLLOW ROAD | 2 | | 10913 WEISBUCH RD | 2 | | 10953 DOE RUN LN | 2 | | 11480 TEDROW LN | 2 | | 11717 HWY 50 | 2 | | 11882 DEEP CUT LAKE RD | 2 | | 12581 CHICKEN FARM RD. | 2 | | 12785 CHICKEN FARM RD | 2 | | 12787 CHICKEN FARM ROAD | 2 | | 13763 CHICKEN FARM RD | 2 | | |
|
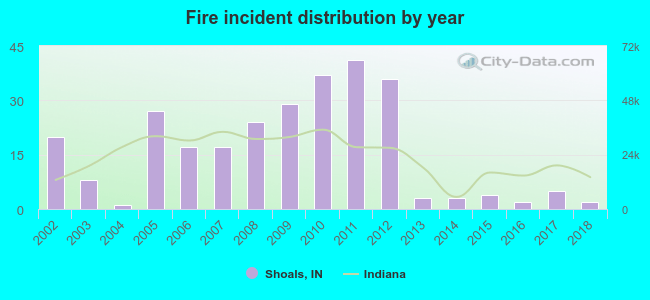 According to the data from the years 2002 - 2018 the average number of fires per year is 16. The highest number of fires - 41 took place in 2011, and the least - 1 in 2004. The data has a dropping trend.
 27.5% incidents where reported in the morning and 72.5% in the evening. The most fires (18.8%) took place on Saturday, and the least (11.2%) on Tuesday.
 According to the 276 fire incident reports from years 2002 - 2018 most fires (14.9%) took place during November, and the least (4.0%) in May.
 Out of all 480 cases reported during the years 2002 - 2018, the most belonged to the categories: Fire (57.5%), Hazardous Condition (18.5%), and Rescue & EMS (13.1%).
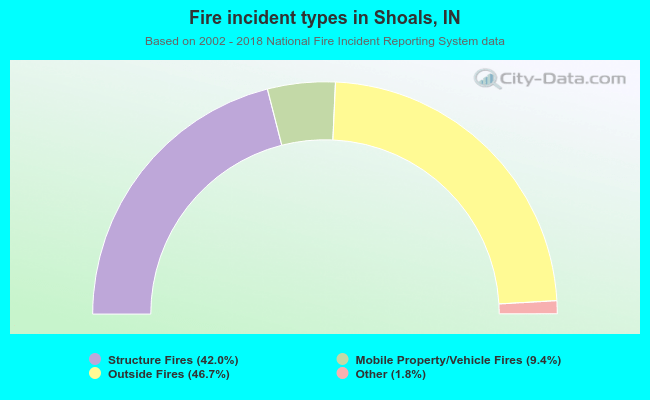 When looking into fire subcategories, the most reports belonged to: Outside Fires (46.7%), and Structure Fires (42.0%).