Sibley: Fire Incidents, Louisiana (LA)
Where are fire incidents reported in Sibley, LA
Something went wrong! Please refresh the page.
|
| |||||||||||||||||||||||||||||||||||||||||||||||||||||||||||||||||||||||||||||||||||||||||||||||||||||||||||||
2002 - 2018 National Fire Incident Reporting System (NFIRS) incidents
- Incident types reported to NFIRS in Sibley, LA
- 17977.5%Fire
- 2510.8%Hazardous Condition
- 104.3%Good Intent Call
- 62.6%Rescue & EMS
- 52.2%Service Call
- 31.3%Severe Weather
- 20.9%False Alarm
- 10.4%Special Incident
- Fire incident types reported to NFIRS in Sibley, LA
- 10156.4%Outside Fires
- 5530.7%Structure Fires
- 147.8%Other
- 95.0%Mobile Property/Vehicle Fires
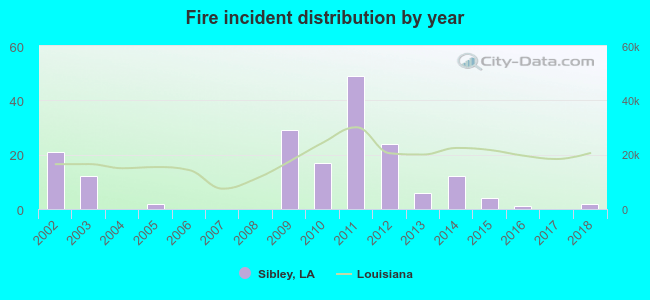 Based on the data from the years 2002 - 2018 the average number of fire incidents per year is 11. The highest number of reported fire incidents - 49 took place in 2011, and the least - 0 in 2004. The data has a decreasing trend.
 19.6% incidents where reported in the morning and 80.4% in the evening. The most fires (19.0%) took place on Saturday, and the least (12.3%) on Wednesday.
 According to the 179 fires from years 2002 - 2018 most fires (16.8%) took place during January, and the least (3.9%) in November.
 Out of all 231 cases reported during the years 2002 - 2018, the most belonged to the categories: Fire (77.5%), Rescue & EMS (10.8%), and Service Call (4.3%).
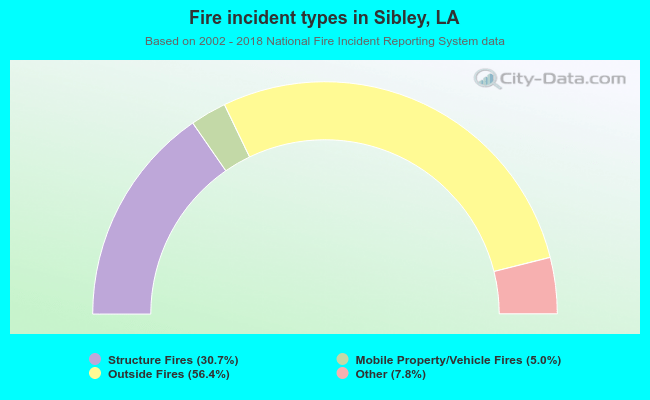 When looking into fire subcategories, the most reports belonged to: Outside Fires (56.4%), and Structure Fires (30.7%).