Sidney: Fire Incidents, Ohio (OH)
Where are fire incidents reported in Sidney, OH
Something went wrong! Please refresh the page.
| Fire incidents reported | |
|---|---|
| Sreet name | Count |
| MICHIGAN ST | 220 |
| FAIR RD | 106 |
| MAIN AV | 106 |
| NORTH ST | 100 |
| COURT ST | 94 |
| KIRKWOOD RD | 94 |
| KUTHER RD | 88 |
| CAMPBELL RD | 86 |
| RUSSELL RD | 84 |
| CISCO RD | 82 |
| RIVERSIDE DR | 82 |
| WAPAKONETA AV | 68 |
| FERGUSON CT | 66 |
| HARDIN WAPAKONETA RD | 62 |
| RIVER RD | 62 |
| VANDEMARK RD | 62 |
| IS 75 | 60 |
| ARROWHEAD DR | 52 |
| MIAMI AV | 52 |
| SCHENK RD | 52 |
| MAIN AVE | 50 |
| OHIO AV | 50 |
| POPLAR ST | 50 |
| MASON RD | 48 |
| ST MARYS RD | 48 |
| SR 29 RT | 46 |
| 75 IS | 42 |
| INDUSTRIAL DR | 42 |
| STOLLE AVE | 42 |
| FOURTH AV | 38 |
| Other | 570 |
2002 - 2018 National Fire Incident Reporting System (NFIRS) incidents
- Incident types reported to NFIRS in Sidney, OH
- 15,10362.1%Rescue & EMS
- 2,70411.1%Fire
- 2,1989.0%Hazardous Condition
- 1,7267.1%Service Call
- 1,2835.3%Good Intent Call
- 1,1814.9%False Alarm
- 430.2%Special Incident
- 360.1%Severe Weather
- 290.1%Overpressure Rupture
- Fire incident types reported to NFIRS in Sidney, OH
- 1,50555.7%Structure Fires
- 77628.7%Outside Fires
- 40915.1%Mobile Property/Vehicle Fires
- 140.5%Other
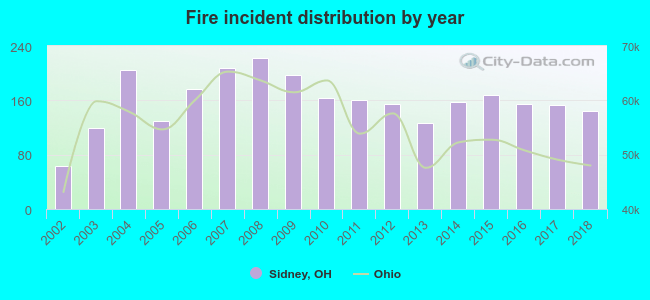 Based on the data from the years 2002 - 2018 the average number of fire incidents per year is 159. The highest number of reported fire incidents - 223 took place in 2008, and the least - 63 in 2002. The data has a rising trend.
The average number of yearly fire incidents per 10k residents in Sidney, OH compared to nearest cities:
(Note: Based on data for the last 3 years, including only cities with population 5,000 and above)
| Sidney: | 71.9 |
| Piqua: | 52.7 |
| Troy: | 30.9 |
| Wapakoneta: | 66.9 |
| Bellefontaine: | 44.8 |
| Tipp City: | 55.5 |
| Urbana: | 68.3 |
| New Carlisle: | 93.9 |
| Greenville: | 75.4 |
 The median response time based on all reported fire incidents is 8 minutes. This is higher compared to the Ohio median value.
The median response time in Sidney, OH compared to nearest cities:
(Note: Based on data for all years, including only cities with at least 500 fire incidents)
| Sidney: | 8 minutes |
| Anna: | 9 minutes |
| Piqua: | 8 minutes |
| Troy: | 7 minutes |
| Wapakoneta: | 8 minutes |
| West Liberty: | 9 minutes |
| Bellefontaine: | 6 minutes |
| Tipp City: | 10 minutes |
| Urbana: | 8 minutes |
 According to the data from the years 2002 - 2018 the average number of fire-related fatalities per year is 1. The highest number of reported deaths - 3 took place in 2008, and the lowest - 0 in 2002. The data has a constant trend.
The average number of fatalities per 1,000 fire incidents is 4. This indicator was the highest - 13 in 2008, and the lowest 0 in 2002. The trend for fatalities per 1,000 fires is dropping. Compared to the state value the number of deaths per 1,000 fire incidents is higher.
According to the data from the years 2002 - 2018 the average number of fire-related fatalities per year is 1. The highest number of reported deaths - 3 took place in 2008, and the lowest - 0 in 2002. The data has a constant trend.
The average number of fatalities per 1,000 fire incidents is 4. This indicator was the highest - 13 in 2008, and the lowest 0 in 2002. The trend for fatalities per 1,000 fires is dropping. Compared to the state value the number of deaths per 1,000 fire incidents is higher.Deaths per 1,000 incidents in Sidney, OH compared to nearest cities:
(Note: Based on data for all years, including only cities with at least 2,500 fire incidents)
| Sidney: | 4.1 |
 According to the reports from the years 2002 - 2018 the average number of fire-related yearly casualties is 5. The highest number of reported casualties - 13 took place in 2006, and the lowest - 0 in 2002. The data has a rising trend.
The average number of injuries per 1,000 fires is 32. This indicator was the highest - 82 in 2014, and the lowest 0 in 2002. The trend for casualties per 1,000 fires is growing. Compared to the state value the number of casualties per 1,000 fires is much higher.
According to the reports from the years 2002 - 2018 the average number of fire-related yearly casualties is 5. The highest number of reported casualties - 13 took place in 2006, and the lowest - 0 in 2002. The data has a rising trend.
The average number of injuries per 1,000 fires is 32. This indicator was the highest - 82 in 2014, and the lowest 0 in 2002. The trend for casualties per 1,000 fires is growing. Compared to the state value the number of casualties per 1,000 fires is much higher.Casualties per 1,000 incidents in Sidney, OH compared to nearest cities:
(Note: Based on data for all years, including only cities with at least 500 fire incidents)
| Sidney: | 34.0 |
| Anna: | 6.6 |
| Piqua: | 12.0 |
| Troy: | 4.4 |
| Wapakoneta: | 6.6 |
| West Liberty: | 0.0 |
| Bellefontaine: | 27.9 |
| Tipp City: | 9.2 |
| Urbana: | 21.0 |
 32.0% incidents where reported in the morning and 68.0% in the evening. The most fires (15.6%) took place on Sunday, and the least (13.3%) on Thursday.
 According to the 2,704 fire incidents from years 2002 - 2018 most fires (10.2%) took place during April, and the least (6.8%) in September.
 Out of all 24,303 cases reported during the years 2002 - 2018, the most belonged to the categories: Rescue & EMS (62.1%), Fire (11.1%), and Hazardous Condition (9.0%).
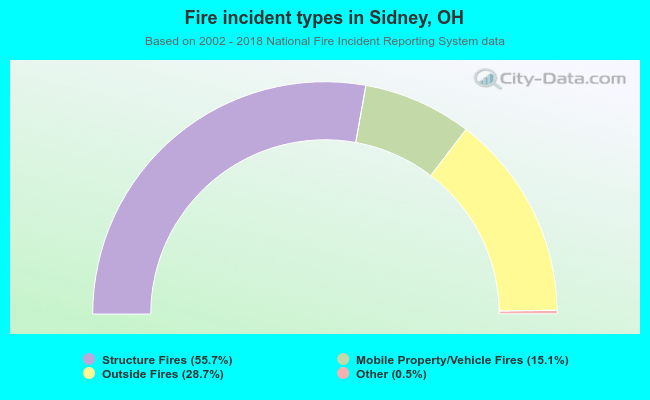 When looking into fire subcategories, the most incidents belonged to: Structure Fires (55.7%), and Outside Fires (28.7%).