| Fire incidents reported |
|---|
| Sreet name | Count |
|---|
| HWY 8 | 18 | | HWY 465 | 16 | | SHADYWOOD DR | 14 | | FOREST DR | 10 | | 465 HWY | 6 | | 4525 HWY 8 | 4 | | CHIPPER LN | 4 | | SHADY WOOD | 4 | | SHADYWOOD DR | 4 | | 121 DALE FUNDERBURK RD | 2 | | 196 BUCK RUN ROAD | 2 | | 2016 FOREST DRIVE | 2 | | 231 FOREST DRIVE | 2 | | 266 FOREST DRIVE | 2 | | 296 SHADYWOOD DRIVE | 2 | | 342 FOREST DRIVE | 2 | | 382 DOGWOOD LANE | 2 | | 4262 HWY 8 | 2 | | 464 WLCOME CEMATRY RD | 2 | | 465 AND HWY 28 | 2 | | 465 EAST BENNETT COLLINS ROAD | 2 | | 4902 HWY 8 | 2 | | 495 WELCOME CEMATARY RD | 2 | | 495 WELCOME CEMATARY ROAD | 2 | | 495 WELCOME CEMETERY RD. | 2 |
| | | Fire incidents reported |
|---|
| Sreet name | Count |
|---|
| 5238 HWY 8 | 2 | | 5283 HWY 8 | 2 | | 5644 HWY. 465 | 2 | | 592 DOGWOOD LANE | 2 | | 6131 HWY 8 | 2 | | 6471 HWY 465 | 2 | | 6604 HWY 465 | 2 | | 7256 HWY 465 | 2 | | 786 FOREST DRIVE | 2 | | 8 HWY | 2 | | 8922 HWY 8 | 2 | | ACORN DRIVE | 2 | | BACK OF 265 CHIPPER LN | 2 | | BAILEY LN | 2 | | BENNETT-COLLINS LOOP | 2 | | BREWER CEMETARY RD | 2 | | CALCASIEN | 2 | | CEM RD | 2 | | CHIPPER LANE | 2 | | DALE FUNDERBURK RD | 2 | | DALE FUNDERBURK RD. | 2 | | DOGWOOD LANE | 2 | | DOGWOOD LANE AND 465 | 2 | | ELMER BENNETT ROAD | 2 | | |
|
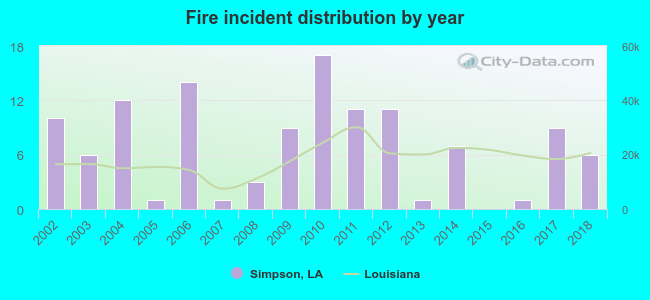 Based on the data from the years 2002 - 2018 the average number of fire incidents per year is 7. The highest number of reported fire incidents - 17 took place in 2010, and the least - 0 in 2015. The data has a decreasing trend.
 25.2% incidents where reported in the morning and 74.8% in the evening. The most fires (23.5%) took place on Saturday, and the least (7.6%) on Tuesday.
 According to the 119 fires from years 2002 - 2018 most fires (14.3%) took place during January, and the least (2.5%) in June.
 Out of all 172 cases reported during the years 2002 - 2018, the most belonged to the categories: Fire (69.2%), Rescue & EMS (13.4%), and Service Call (8.7%).
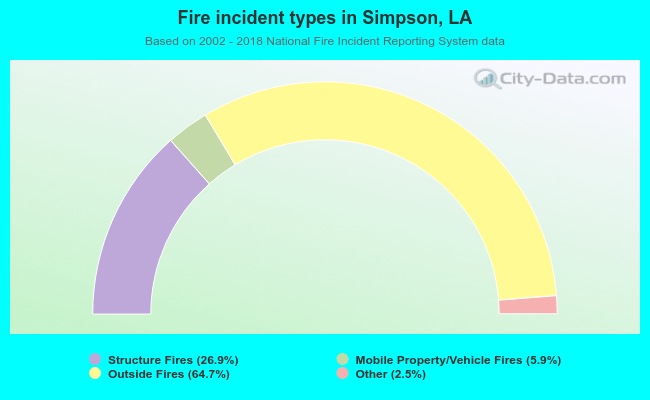 When looking into fire subcategories, the most reports belonged to: Outside Fires (64.7%), and Structure Fires (26.9%).