| Fire incidents reported |
|---|
| Sreet name | Count |
|---|
| 2415 SD HWY 10 | 8 | | 12467 456 AVE | 4 | | 12601 BIA 700 | 4 | | 1 MILE S OF CO RD 33 ON CO RD | 2 | | 101 W OAK ST | 2 | | 1038 LITTLE CROW DRIVE | 2 | | 11189 453 RD AVE | 2 | | 112 ST 455 AVE | 2 | | 11213 455 AVE | 2 | | 11214 465TH AVE | 2 | | 11214 465TH AVENUE | 2 | | 11521 457 AVE | 2 | | 11609 458 AVE | 2 | | 11681 BIA HWY 800 | 2 | | 117 ST 451 AVE | 2 | | 117 TH ST 456 TH AVE | 2 | | 11730 SD HY 127 | 2 | | 11814 461 AVE | 2 | | 11823 464 AVE | 2 | | 11864 455 AVE | 2 | | 119 5TH ST | 2 | | 11931 462 AVE | 2 | | 11983 DRYWOOD LAKE | 2 | | 12 MILE N OF HWY 10 CO 6 | 2 | | 12 MILE S OF HWY 10 ON RD 34 | 2 |
| | | Fire incidents reported |
|---|
| Sreet name | Count |
|---|
| 120 ST 467 AVE | 2 | | 120ST 465AVE | 2 | | 12151 450TH AVE | 2 | | 12152 460 AVE | 2 | | 12154 462AVE | 2 | | 122 ND 461 AVE | 2 | | 12226 456 AVE | 2 | | 12279 455TH AVE | 2 | | 123 CHESTNUT ST | 2 | | 12379 460 AVE | 2 | | 12421 CO RD 28 | 2 | | 12523 456TH AVE | 2 | | 126 ST 457 AVE | 2 | | 12673 DRYWOOD LAKE RD | 2 | | 127 ST 457 AVE | 2 | | 12757 WHIPLE ROAD | 2 | | 129 TH ONE ROAD LK | 2 | | 12925 454 AVE COUNTY ROAD 28 | 2 | | 130 ST 450 TH AVE | 2 | | 130 ST 465 | 2 | | 13037 BIA 121 | 2 | | 133 ST 459 AVE | 2 | | 13406 455TH AVE | 2 | | 14 MILE WEST OF CONTY ROAD 34 | 2 | | |
|
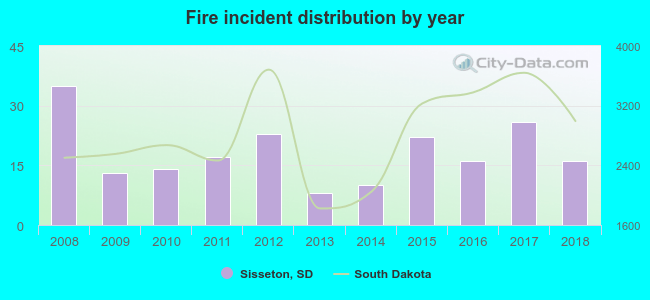 According to the data from the years 2008 - 2018 the average number of fires per year is 18. The highest number of reported fire incidents - 35 took place in 2008, and the least - 8 in 2013. The data has a declining trend.
 28.5% incidents where reported in the morning and 71.5% in the evening. The most fires (19.5%) took place on Saturday, and the least (11.0%) on Sunday.
 According to the 200 incident reports from years 2008 - 2018 most fires (15.0%) took place during July, and the least (4.5%) in February.
 Out of all 235 cases reported during the years 2008 - 2018, the most belonged to the categories: Fire (85.1%), Rescue & EMS (7.2%), and Hazardous Condition (2.1%).
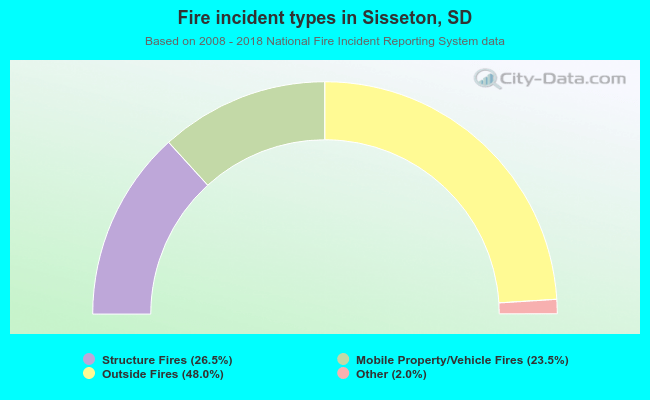 When looking into fire subcategories, the most incidents belonged to: Outside Fires (48.0%), and Structure Fires (26.5%).