| Fire incidents reported |
|---|
| Sreet name | Count |
|---|
| 206 STATE HWY HWY | 40 | | MONTGOMERY RD | 34 | | U.S ROUTE 206 | 24 | | WALL ST | 22 | | SKILLMAN RD | 18 | | HOLLINSHEAD SPRING RD | 16 | | US ROUTE 206 | 14 | | 120 MONTGOMERY RD | 12 | | BALLANTINE LN | 12 | | BLUE SPRING RD | 12 | | COUNTY 601 RT | 12 | | BEDENS BROOK RD | 10 | | GRAND VIEW RD | 10 | | ROUTE 518 | 10 | | COUNTY 518 RT | 8 | | CR 518 | 8 | | OPOSSUM RD | 8 | | BLUE SPRING RD | 6 | | BURNT HILL RD | 6 | | CHICOPEE DR | 6 | | COLFAX RD | 6 | | GREAT RD | 6 | | HOLLINSHEAD SPRING RD. | 6 | | HOLLOW RD | 6 | | MAIN BLVD | 6 |
| | | Fire incidents reported |
|---|
| Sreet name | Count |
|---|
| MONTGOMERY RD | 6 | | ROUTE 601 | 6 | | SKILLMAN RD | 6 | | SUNSET RD | 6 | | 10 SUNSET RD | 4 | | 373 BURNT HILL RD | 4 | | 92 ROLLING HILL RD | 4 | | BEDENS BROOK RD | 4 | | BURN'T HILL RD | 4 | | BURNT HILL RD. | 4 | | CHERRY HILL RD | 4 | | COUNTRY CLUB DR | 4 | | CR 533 | 4 | | CR 601 | 4 | | CR518 | 4 | | DUTCHTOWN ZION RD | 4 | | HIGH RIDGE RD | 4 | | HOLLOW ROAD RD | 4 | | MAIN BLVD | 4 | | MARTEN RD | 4 | | MC KINLEY CT | 4 | | MCKINLEY CT. | 4 | | MEADOW RUN DR | 4 | | OPOSSUM RD | 4 | | |
|
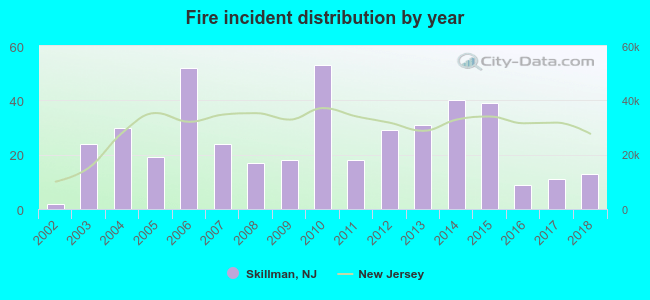 According to the data from the years 2002 - 2018 the average number of fires per year is 25. The highest number of reported fires - 53 took place in 2010, and the least - 2 in 2002. The data has a growing trend.
 32.6% incidents where reported in the morning and 67.4% in the evening. The most fires (19.3%) took place on Friday, and the least (9.3%) on Tuesday.
 According to the 429 fires from years 2002 - 2018 most fires (12.8%) took place during April, and the least (4.2%) in August.
 Out of all 1,835 cases reported during the years 2002 - 2018, the most belonged to the categories: False Alarm (31.2%), Fire (23.4%), and Hazardous Condition (23.1%).
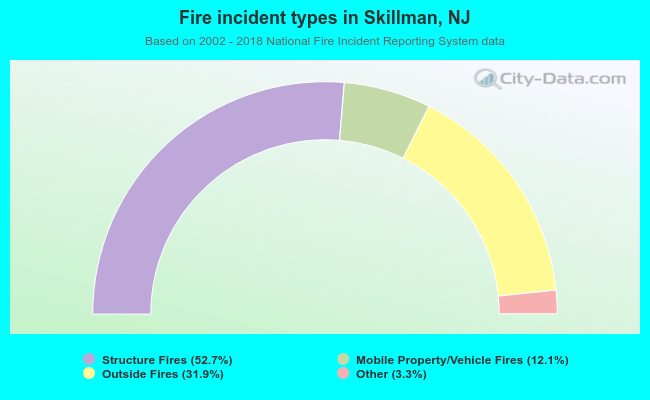 When looking into fire subcategories, the most incidents belonged to: Structure Fires (52.7%), and Outside Fires (31.9%).