Skykomish: Fire Incidents, Washington (WA)
Where are fire incidents reported in Skykomish, WA
Something went wrong! Please refresh the page.
|
| |||||||||||||||||||||||||||||||||||||||||||||||||||||||||||||||||||||||||||||||||||||||||||||||||||||
2002 - 2018 National Fire Incident Reporting System (NFIRS) incidents
- Incident types reported to NFIRS in Skykomish, WA
- 54259.1%Rescue & EMS
- 12513.6%Fire
- 9810.7%Good Intent Call
- 677.3%Service Call
- 596.4%Hazardous Condition
- 161.7%False Alarm
- 60.7%Special Incident
- 40.4%Overpressure Rupture
- Fire incident types reported to NFIRS in Skykomish, WA
- 5745.6%Mobile Property/Vehicle Fires
- 3729.6%Structure Fires
- 2520.0%Outside Fires
- 64.8%Other
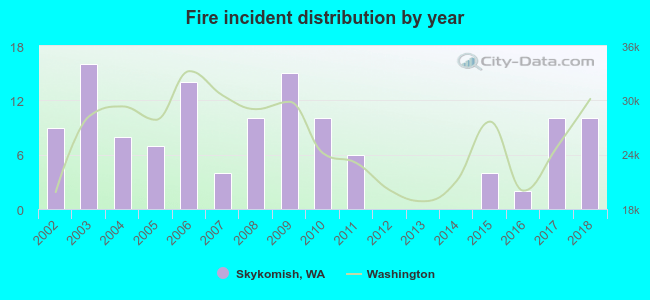 According to the data from the years 2002 - 2018 the average number of fires per year is 7. The highest number of fire incidents - 16 took place in 2003, and the least - 0 in 2012. The data has an increasing trend.
 36.0% incidents where reported in the morning and 64.0% in the evening. The most fires (21.6%) took place on Friday, and the least (8.0%) on Tuesday.
 According to the 125 fires from years 2002 - 2018 most fires (17.6%) took place during July, and the least (3.2%) in November.
 Out of all 917 cases reported during the years 2002 - 2018, the most belonged to the categories: Rescue & EMS (59.1%), Fire (13.6%), and Good Intent Call (10.7%).
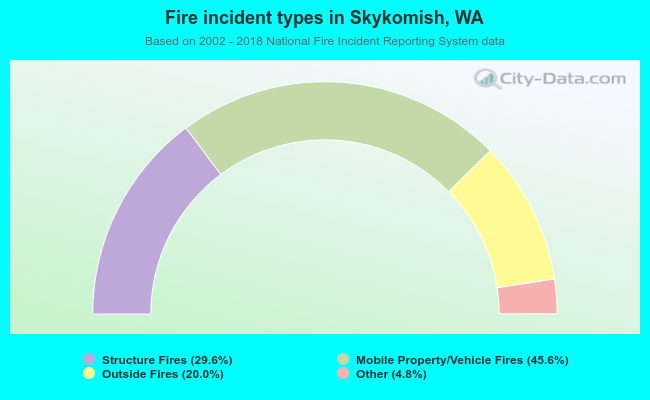 When looking into fire subcategories, the most reports belonged to: Mobile Property/Vehicle Fires (45.6%), and Structure Fires (29.6%).