Slatington: Fire Incidents, Pennsylvania (PA)
Where are fire incidents reported in Slatington, PA
Something went wrong! Please refresh the page.
|
| |||||||||||||||||||||||||||||||||||||||||||||||||||||||||||||||||||||||||||||||||||||||||||||||||||||||||||||
2004 - 2018 National Fire Incident Reporting System (NFIRS) incidents
- Incident types reported to NFIRS in Slatington, PA
- 47433.5%Fire
- 31322.2%Rescue & EMS
- 20814.7%Hazardous Condition
- 15110.7%False Alarm
- 1238.7%Good Intent Call
- 1037.3%Service Call
- 241.7%Special Incident
- 151.1%Severe Weather
- 20.1%Overpressure Rupture
- Fire incident types reported to NFIRS in Slatington, PA
- 24852.3%Structure Fires
- 9720.5%Other
- 8918.8%Outside Fires
- 408.4%Mobile Property/Vehicle Fires
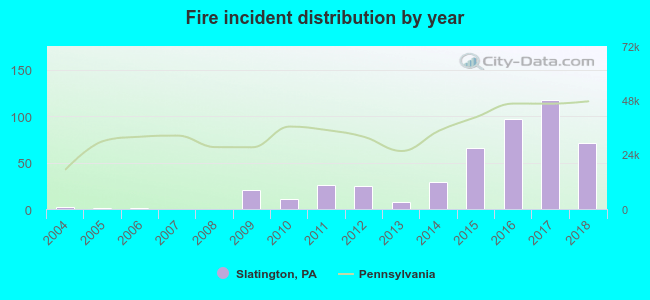 According to the data from the years 2004 - 2018 the average number of fires per year is 32. The highest number of fire incidents - 117 took place in 2017, and the least - 0 in 2007. The data has a rising trend.
 27.8% incidents where reported in the morning and 72.2% in the evening. The most fires (17.3%) took place on Sunday, and the least (11.6%) on Wednesday.
 According to the 474 reports from years 2004 - 2018 most fires (15.4%) took place during March, and the least (4.6%) in September.
 Out of all 1,413 cases reported during the years 2004 - 2018, the most belonged to the categories: Fire (33.5%), Rescue & EMS (22.2%), and Hazardous Condition (14.7%).
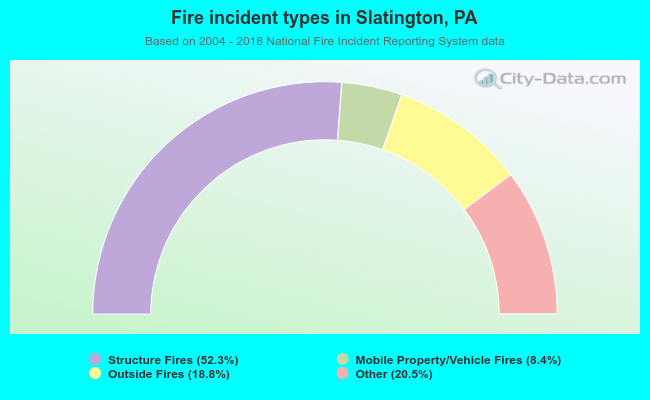 When looking into fire subcategories, the most incidents belonged to: Structure Fires (52.3%), and Other (20.5%).