Sleepy Eye: Fire Incidents, Minnesota (MN)
Where are fire incidents reported in Sleepy Eye, MN
Something went wrong! Please refresh the page.
|
| |||||||||||||||||||||||||||||||||||||||||||||||||||||||||||||||||||||||||||||||||||||||||||||||||||||||||||||
2004 - 2018 National Fire Incident Reporting System (NFIRS) incidents
- Incident types reported to NFIRS in Sleepy Eye, MN
- 18572.8%Fire
- 2811.0%False Alarm
- 259.8%Rescue & EMS
- 83.1%Service Call
- 72.8%Hazardous Condition
- 10.4%Good Intent Call
- Fire incident types reported to NFIRS in Sleepy Eye, MN
- 9450.8%Structure Fires
- 5429.2%Outside Fires
- 3418.4%Mobile Property/Vehicle Fires
- 31.6%Other
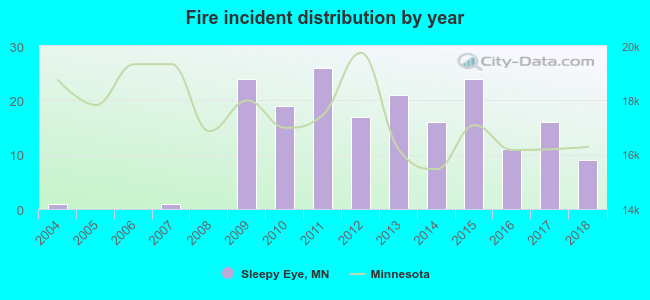 Based on the data from the years 2004 - 2018 the average number of fires per year is 12. The highest number of fire incidents - 26 took place in 2011, and the least - 0 in 2005. The data has a growing trend.
 33.5% incidents where reported in the morning and 66.5% in the evening. The most fires (20.0%) took place on Monday, and the least (8.6%) on Wednesday.
 According to the 185 fire incidents from years 2004 - 2018 most fires (16.2%) took place during October, and the least (3.8%) in March.
 Out of all 254 cases reported during the years 2004 - 2018, the most belonged to the categories: Fire (72.8%), Good Intent Call (11.0%), and Overpressure Rupture (9.8%).
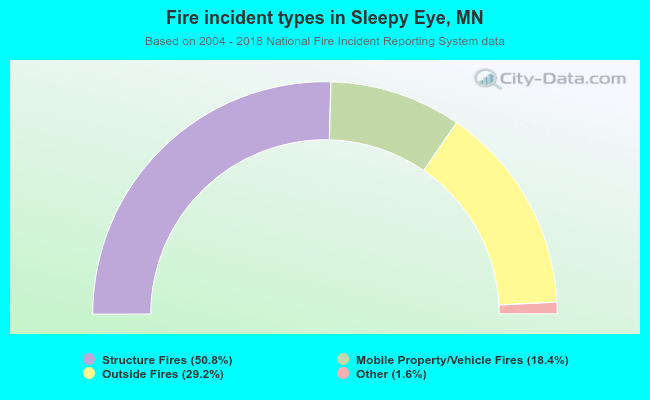 When looking into fire subcategories, the most reports belonged to: Structure Fires (50.8%), and Outside Fires (29.2%).