| Fire incidents reported |
|---|
| Sreet name | Count |
|---|
| RAILROAD ST | 32 | | BEAVER MEADOW RD | 20 | | COUNTY RD 22 | 16 | | COUNTY RD 14 | 14 | | STATE HWY 80 | 14 | | BOOSLAW RD | 12 | | BLIVENCOYE HILL RD | 10 | | ROURKE RD | 8 | | TINKER RIDGE RD | 8 | | DAVIS RD | 6 | | SKYVIEW LN | 6 | | W MAIN ST | 6 | | BLIVEN-COYE HILL RD | 4 | | COUNTY RD 16 | 4 | | COUNTY RD 20 | 4 | | COUNTY RD 21 | 4 | | DAVIS RD | 4 | | DAVIS ROAD | 4 | | GERMAN HOLLOW RD | 4 | | GIBSONTAYLOR RD | 4 | | RT 80 WEST | 4 | | SCHOOL | 4 | | SIMMONS SPUR RD | 4 | | 108 BLIVEN COY HILL ROAD | 2 | | 141 ROURKE RD | 2 |
| | | Fire incidents reported |
|---|
| Sreet name | Count |
|---|
| 5 RAILROAD ST. | 2 | | BEAVER MEADOW ROAD | 2 | | BOOS-LAW RD. | 2 | | BOOSFORDLAW RD | 2 | | CARNCROSS ROAD | 2 | | CO. RT 22 | 2 | | COLE RD | 2 | | COUNTY 22 | 2 | | COYE HILL ROAD | 2 | | CURNCROSS RD | 2 | | E MAIN | 2 | | E MAIN ST | 2 | | EAST SCHOOL ST | 2 | | FLATIRON RD | 2 | | FOSTER RD | 2 | | GIBSONTAYLOR RD | 2 | | GRAHAM RD | 2 | | HOPKINSCRANDALL RD | 2 | | MAIN ST | 2 | | MAIN STREET | 2 | | NEW ST | 2 | | QUAKER HILL RD | 2 | | REIT RD | 2 | | SCHOOL STREET | 2 | | SOUTH LEBANON RD | 2 |
|
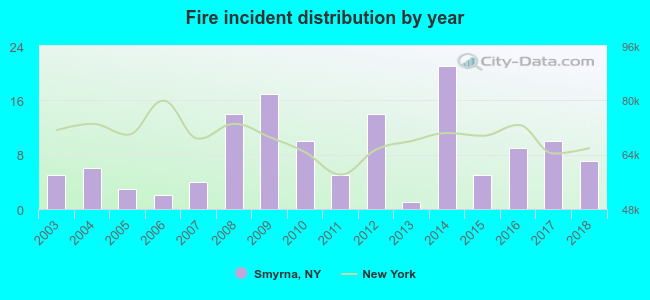 According to the data from the years 2003 - 2018 the average number of fires per year is 8. The highest number of fire incidents - 21 took place in 2014, and the least - 1 in 2013. The data has a growing trend.
 33.8% incidents where reported in the morning and 66.2% in the evening. The most fires (19.5%) took place on Wednesday, and the least (9.0%) on Sunday.
 Based on the 133 reports from years 2003 - 2018 most fires (17.3%) took place during January, and the least (3.0%) in August.
 Out of all 832 cases reported during the years 2003 - 2018, the most belonged to the categories: Rescue & EMS (61.7%), Fire (16.0%), and Hazardous Condition (11.7%).
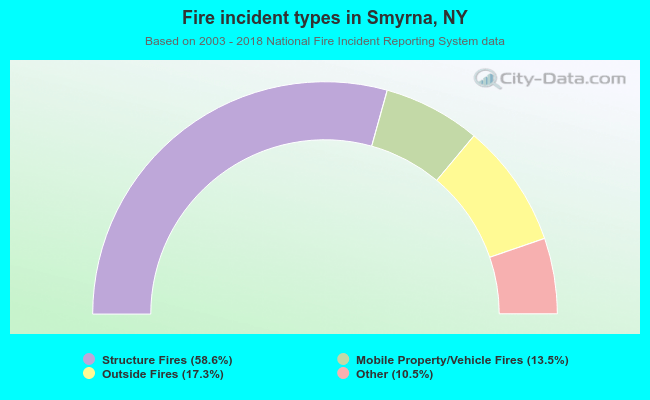 When looking into fire subcategories, the most incidents belonged to: Structure Fires (58.6%), and Outside Fires (17.3%).