| Fire incidents reported |
|---|
| Sreet name | Count |
|---|
| KYLES FORD HWY | 16 | | PANTHER CRK RD | 16 | | COOL BRANCH RD | 14 | | PANTHER CREEK RD | 12 | | MAIN STREET | 10 | | HWY 31 | 8 | | HWY 66 | 8 | | TAZEWELL HWY | 8 | | BOWLIN STREET | 6 | | CAMPBELL DRIVE | 6 | | FERGUISON CEMETARY ROAD | 6 | | FOX BRANCH RD | 6 | | HIGHWAY 33 | 6 | | HWY 33 | 6 | | HWY 66 N | 6 | | JOHNSON RIDGE RD | 6 | | JOHNSONS RIDGE RD | 6 | | LONG HOLLOW | 6 | | MAIN ST | 6 | | ROCK HILL RD | 6 | | SHERM MOUNTAIN ROAD | 6 | | 111 WOODY LN | 4 | | 8418 TAZEWELL HWY | 4 | | 998 NEWMANS RIDGE ROAD | 4 | | ALDER RD | 4 |
| | | Fire incidents reported |
|---|
| Sreet name | Count |
|---|
| BROOKS RD | 4 | | CAMPBELL DR | 4 | | CHARLES STREET | 4 | | CHINQUINPIN RD | 4 | | DUCK CREEK RD | 4 | | DUCK CREEK ROAD | 4 | | FERGERSON CEMETARY ROAD | 4 | | FERGUSON ROAD | 4 | | GREENWAY STREET | 4 | | HIGHWAY 63 | 4 | | HWY33/LIVESAYCHAPELRD | 4 | | MAIN ST | 4 | | NATTIE BRANCH RD | 4 | | NEWMANS RIDGE RD | 4 | | NEWMANS RIDGE ROAD | 4 | | SINGLETON RD | 4 | | TURNER HOMES | 4 | | WAR CREEK RD | 4 | | 1035 WEST SHORT MOUNTAIN ROAD | 2 | | 1048 NEWMANS RIDGE RD | 2 | | 110 BYRD CREEK RD | 2 | | 1130 DEAR RUN | 2 | | 1132 CAMPBELL DRIVE | 2 | | 1136 SHERM MOUNTAIN ROAD | 2 | | 1180 PROSPECT ROAD | 2 |
|
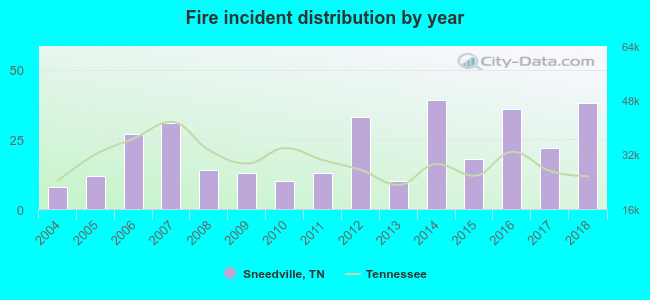 According to the data from the years 2004 - 2018 the average number of fire incidents per year is 22. The highest number of reported fire incidents - 39 took place in 2014, and the least - 8 in 2004. The data has a rising trend.
 25.3% incidents where reported in the morning and 74.7% in the evening. The most fires (17.9%) took place on Thursday, and the least (11.4%) on Tuesday.
 Based on the 324 incident reports from years 2004 - 2018 most fires (16.0%) took place during March, and the least (3.4%) in August.
 Out of all 456 cases reported during the years 2004 - 2018, the most belonged to the categories: Fire (71.1%), Good Intent Call (12.7%), and Hazardous Condition (4.6%).
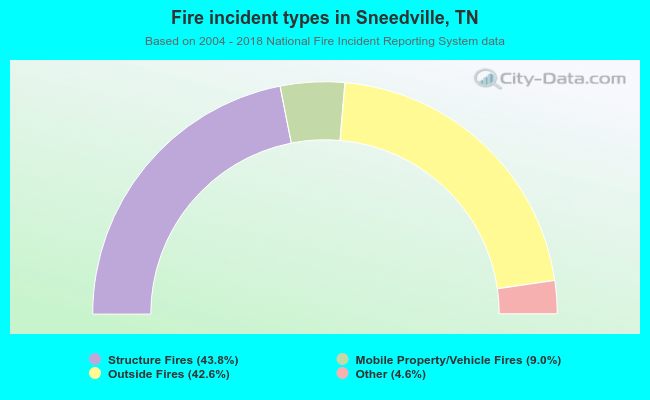 When looking into fire subcategories, the most reports belonged to: Structure Fires (43.8%), and Outside Fires (42.6%).