Snowflake: Fire Incidents, Arizona (AZ)
Where are fire incidents reported in Snowflake, AZ
Something went wrong! Please refresh the page.
|
| |||||||||||||||||||||||||||||||||||||||||||||||||||||||||||||||||||||||||||||||||||||||||||||||||||||||||||||
| Other | 117 | |||||||||||||||||||||||||||||||||||||||||||||||||||||||||||||||||||||||||||||||||||||||||||||||||||||||||||||
2005 - 2018 National Fire Incident Reporting System (NFIRS) incidents
- Incident types reported to NFIRS in Snowflake, AZ
- 35942.5%Fire
- 12815.1%Service Call
- 11513.6%Hazardous Condition
- 11213.3%Good Intent Call
- 8510.1%Rescue & EMS
- 425.0%False Alarm
- 20.2%Overpressure Rupture
- 20.2%Special Incident
- Fire incident types reported to NFIRS in Snowflake, AZ
- 15543.2%Outside Fires
- 12033.4%Structure Fires
- 5715.9%Other
- 277.5%Mobile Property/Vehicle Fires
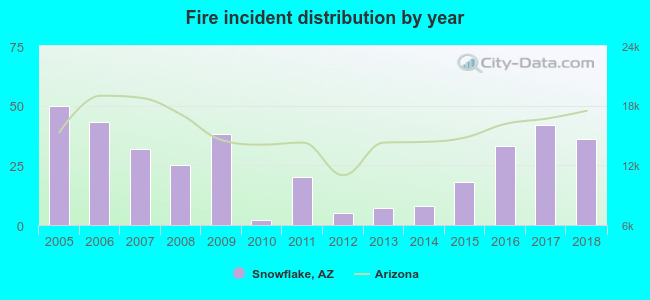 Based on the data from the years 2005 - 2018 the average number of fire incidents per year is 26. The highest number of fire incidents - 50 took place in 2005, and the least - 2 in 2010. The data has a dropping trend.

 34.3% incidents where reported in the morning and 65.7% in the evening. The most fires (18.9%) took place on Saturday, and the least (8.9%) on Sunday.
 Based on the 359 fires from years 2005 - 2018 most fires (12.8%) took place during February, and the least (4.7%) in September.
 Out of all 845 cases reported during the years 2005 - 2018, the most belonged to the categories: Fire (42.5%), Service Call (15.1%), and Hazardous Condition (13.6%).
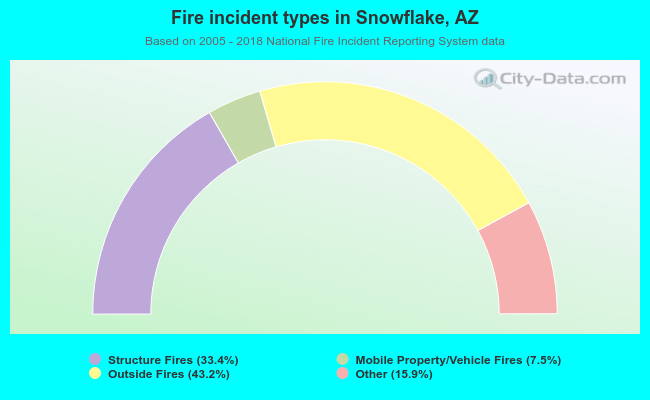 When looking into fire subcategories, the most reports belonged to: Outside Fires (43.2%), and Structure Fires (33.4%).