South Salem: Fire Incidents, Ohio (OH)
Where are fire incidents reported in South Salem, OH
Something went wrong! Please refresh the page.
|
| |||||||||||||||||||||||||||||||||||||||||||||||||||||||||||||||||||||||||||||||||||||
2002 - 2018 National Fire Incident Reporting System (NFIRS) incidents
- Incident types reported to NFIRS in South Salem, OH
- 12760.2%Fire
- 4119.4%Hazardous Condition
- 146.6%Service Call
- 136.2%Rescue & EMS
- 125.7%Good Intent Call
- 31.4%False Alarm
- 10.5%Overpressure Rupture
- Fire incident types reported to NFIRS in South Salem, OH
- 5845.7%Structure Fires
- 4031.5%Outside Fires
- 2922.8%Mobile Property/Vehicle Fires
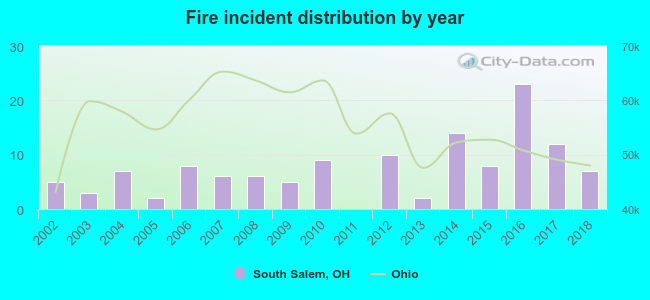 Based on the data from the years 2002 - 2018 the average number of fire incidents per year is 7. The highest number of fire incidents - 23 took place in 2016, and the least - 0 in 2011. The data has a growing trend.
 35.4% incidents where reported in the morning and 64.6% in the evening. The most fires (18.1%) took place on Wednesday, and the least (9.4%) on Friday.
 Based on the 127 reports from years 2002 - 2018 most fires (13.4%) took place during April, and the least (3.1%) in September.
 Out of all 211 cases reported during the years 2002 - 2018, the most belonged to the categories: Fire (60.2%), Hazardous Condition (19.4%), and Service Call (6.6%).
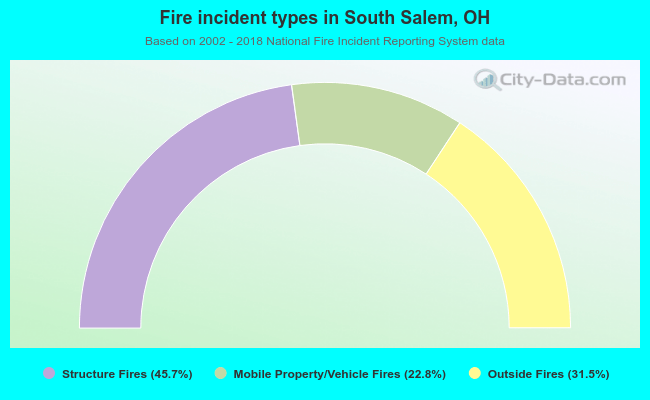 When looking into fire subcategories, the most reports belonged to: Structure Fires (45.7%), and Outside Fires (31.5%).