| Fire incidents reported |
|---|
| Sreet name | Count |
|---|
| MAIN ST | 24 | | HIGH ST | 14 | | CHARLESTON-CHILLICOTHE RD | 10 | | FRALICK RD | 10 | | GORDON ST | 10 | | SR 323 | 10 | | WASHINGTON ST | 8 | | BOOKWALTER RD | 6 | | COLUMBUSXENIA RD | 6 | | HARROLD RD | 6 | | HIGHWAY 41 | 6 | | MINSHALL RD | 6 | | MOON RD | 6 | | ST RT 38 RD | 6 | | ST. RT. 323 RD | 6 | | COUNTS RD. RD | 4 | | GORDON RD | 4 | | HUNTINGTON RD | 4 | | PRAIRIE RD | 4 | | SR 323 RD | 4 | | STATE ROUTE 41 | 4 | | 2222 SR 323 SW | 2 | | BLESSING CHAPEL RD | 2 | | BLESSINGCHAPEL RD | 2 | | BROCK ROAD RD | 2 |
| | | Fire incidents reported |
|---|
| Sreet name | Count |
|---|
| CHARLESTON OLD CHILLICO | 2 | | CHARLESTON-CHILLICOTHE. RD | 2 | | CHARLESTONCHILLICOTHE RD | 2 | | CHILICOTHE ST | 2 | | CLEVELAND ST | 2 | | COLUMBUS XENIA RD | 2 | | E MAIN ST | 2 | | FENT RD. | 2 | | FRALICK ROAD RD | 2 | | GATES LANE | 2 | | GATES LN | 2 | | GLADE RUN ROAD | 2 | | MAIN ST | 2 | | MAIN ST ST | 2 | | MCDORMAN RD | 2 | | MEKENDRIA | 2 | | MIDWAY ROAD RD | 2 | | MINSHALL RD RD | 2 | | MINSHALL ROAD | 2 | | MOON EVANS RD | 2 | | OLD XENIA RD | 2 | | PALMER RD | 2 | | PRAIRIE RD RD | 2 | | RODGERS RD | 2 | | |
|
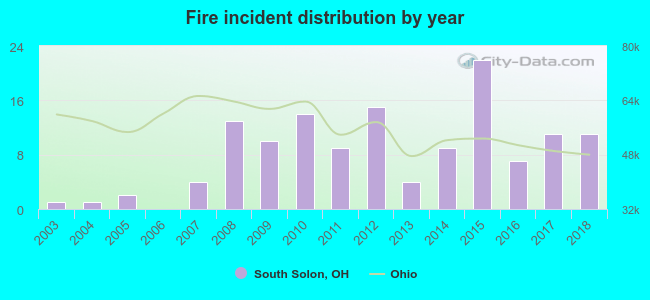 Based on the data from the years 2003 - 2018 the average number of fire incidents per year is 8. The highest number of fire incidents - 22 took place in 2015, and the least - 0 in 2006. The data has a growing trend.
 21.1% incidents where reported in the morning and 78.9% in the evening. The most fires (19.5%) took place on Wednesday, and the least (8.3%) on Friday.
 Based on the 133 reports from years 2003 - 2018 most fires (18.0%) took place during April, and the least (3.8%) in January.
 Out of all 288 cases reported during the years 2003 - 2018, the most belonged to the categories: Fire (46.2%), Service Call (16.3%), and Rescue & EMS (15.6%).
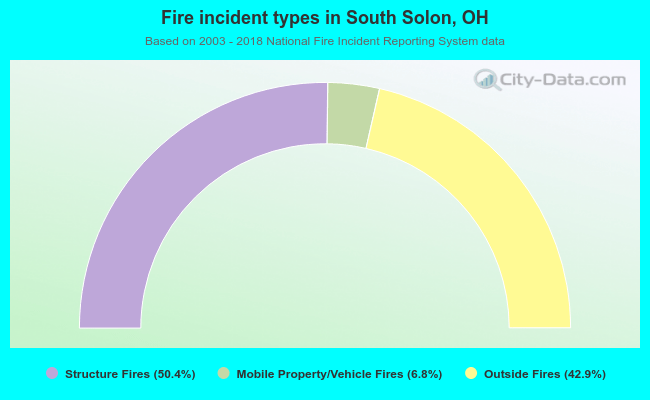 When looking into fire subcategories, the most reports belonged to: Structure Fires (50.4%), and Outside Fires (42.9%).