South Toms River: Fire Incidents, New Jersey (NJ)
Where are fire incidents reported in South Toms River, NJ
Something went wrong! Please refresh the page.
|
| |||||||||||||||||||||||||||||||||||||||||||||||||||||||||||||||||||||||||||||||||||||||||||||||||||||||||||||
2002 - 2017 National Fire Incident Reporting System (NFIRS) incidents
- Incident types reported to NFIRS in South Toms River, NJ
- 14646.5%Fire
- 11837.6%Hazardous Condition
- 185.7%False Alarm
- 154.8%Rescue & EMS
- 134.1%Service Call
- 20.6%Good Intent Call
- 10.3%Severe Weather
- 10.3%Special Incident
- Fire incident types reported to NFIRS in South Toms River, NJ
- 5336.3%Structure Fires
- 4732.2%Outside Fires
- 2416.4%Other
- 2215.1%Mobile Property/Vehicle Fires
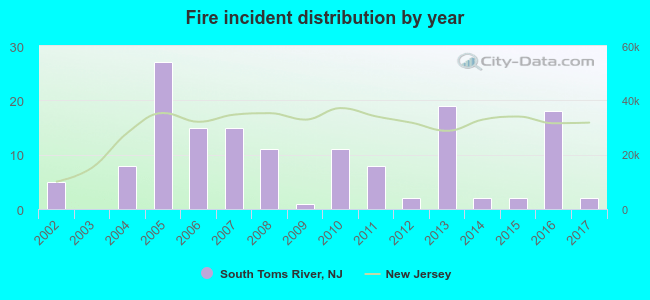 Based on the data from the years 2002 - 2017 the average number of fire incidents per year is 9. The highest number of reported fires - 27 took place in 2005, and the least - 0 in 2003. The data has a declining trend.
 31.5% incidents where reported in the morning and 68.5% in the evening. The most fires (19.9%) took place on Friday, and the least (8.9%) on Wednesday.
 According to the 146 fires from years 2002 - 2017 most fires (13.7%) took place during January, and the least (4.1%) in August.
 Out of all 314 cases reported during the years 2002 - 2017, the most belonged to the categories: Fire (46.5%), Rescue & EMS (37.6%), and Good Intent Call (5.7%).
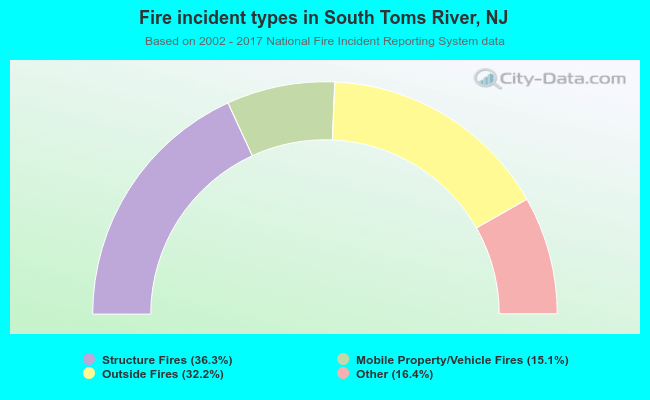 When looking into fire subcategories, the most incidents belonged to: Structure Fires (36.3%), and Outside Fires (32.2%).