| Fire incidents reported |
|---|
| Sreet name | Count |
|---|
| STATE ROAD 5 | 32 | | WHITLEY ROAD | 20 | | 950 WEST | 18 | | STATE ROAD 14 | 18 | | STATE | 12 | | 500 SOUTH | 10 | | 800 SOUTH | 10 | | 150 SOUTH | 8 | | 400 SOUTH | 8 | | 900 WEST | 8 | | 1000 SOUTH | 6 | | 900 SOUTH | 6 | | KEISER ROAD | 6 | | MAIN | 6 | | POOK ROAD | 6 | | STATE ROAD 105 | 6 | | STATE STREET | 6 | | 200 NORTH | 4 | | 200 SOUTH | 4 | | 300 SOUTH | 4 | | 450 WEST | 4 | | 500 WEST | 4 | | 700 | 4 | | 950 | 4 | | 950 W | 4 |
| | | Fire incidents reported |
|---|
| Sreet name | Count |
|---|
| COLUMBIA | 4 | | DIVISION ROAD | 4 | | POOK RD. | 4 | | ST RD 5 AND 900 SOUTH | 4 | | STATE ROAD 114 | 4 | | 100 SOUTH | 2 | | 1000 | 2 | | 101 SOUTH MAIN ST | 2 | | 101 SOUTH STATE ST ST | 2 | | 102 S JEFFERSON | 2 | | 1030 SOUTH WOLF ROAD RDS | 2 | | 1037 SOUTH ST. RD. 105 RD | 2 | | 105 700 S | 2 | | 107 1/2 NORTH MAIN STREET ST | 2 | | 108 SOUTH MAPLE ST | 2 | | 110 WEST FIRST STREET ST | 2 | | 113 MAIN STREET | 2 | | 115 WEST COLUMBIA ST ST | 2 | | 117 NORTH STATE ST | 2 | | 119 SOUTH STATE STREET ST | 2 | | 150 S & 600 W | 2 | | 1816 S 950 W | 2 | | 1ST STREET | 2 | | 1ST. STREET | 2 | | |
|
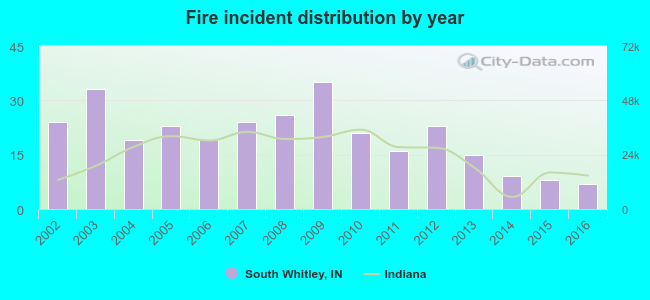 Based on the data from the years 2002 - 2016 the average number of fire incidents per year is 20. The highest number of fires - 35 took place in 2009, and the least - 7 in 2016. The data has a declining trend.
 23.8% incidents where reported in the morning and 76.2% in the evening. The most fires (16.9%) took place on Wednesday, and the least (11.9%) on Sunday.
 According to the 302 incident reports from years 2002 - 2016 most fires (15.9%) took place during April, and the least (3.6%) in November.
 Out of all 896 cases reported during the years 2002 - 2016, the most belonged to the categories: Overpressure Rupture (45.2%), Fire (33.7%), and Service Call (7.5%).
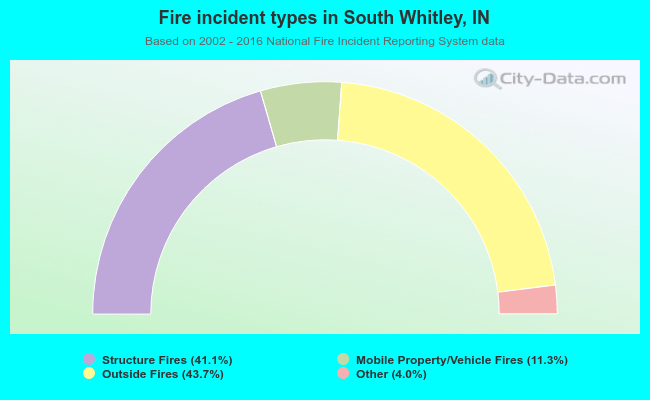 When looking into fire subcategories, the most incidents belonged to: Outside Fires (43.7%), and Structure Fires (41.1%).