| Fire incidents reported |
|---|
| Sreet name | Count |
|---|
| WINDHAM/4 RD | 38 | | BABCOCK HILL RD. | 18 | | JORDAN RD. | 18 | | SO. WINDHAM RD. | 16 | | BABCOCK HILL | 10 | | OLD PLAINS RD | 10 | | OLD WINDHAM RD. | 10 | | WINDHAM4 RD | 10 | | BABCOCK HILL RD | 8 | | OLD PLAINS RD. | 8 | | PLAINS/4 RD | 8 | | WINDHAM RD | 8 | | OLD PLAINS | 6 | | ANTRIM | 4 | | MACHINE SHOP HILL RD. | 4 | | MAIN ST | 4 | | PEMBERTON RD | 4 | | PLAINS4 RD | 4 | | SO WINDHAM | 4 | | WADSWORTH | 4 | | 1000 WINDHAM RD | 2 | | ALICE ST | 2 | | ANTRIM RD. | 2 | | BABCOCK HILL RD | 2 | | BOSTON POST RD | 2 |
| | | Fire incidents reported |
|---|
| Sreet name | Count |
|---|
| BUSH HILL | 2 | | BUSH HILL RD. | 2 | | CLORAN ST. | 2 | | DEER RUN | 2 | | EASTVIEW TERR | 2 | | HAVEN | 2 | | HIGHLAND RD | 2 | | HIGHLAND VIEW DR. | 2 | | JEFFREY | 2 | | JORDAN RD | 2 | | MACHINE SHOP HILL RD | 2 | | MANNERS | 2 | | OLD WINDHAM | 2 | | OLD WINDHAM RD | 2 | | OXBOW DR | 2 | | OXBOW DR. | 2 | | OXBOW/4 DR | 2 | | PALMER RD | 2 | | PEMBERTON | 2 | | PEMBERTON/4 RD | 2 | | PIGEON SWAMP RD. | 2 | | PLAINS RD | 2 | | RUSS DR. | 2 | | SANITARIUM RD. | 2 | | |
|
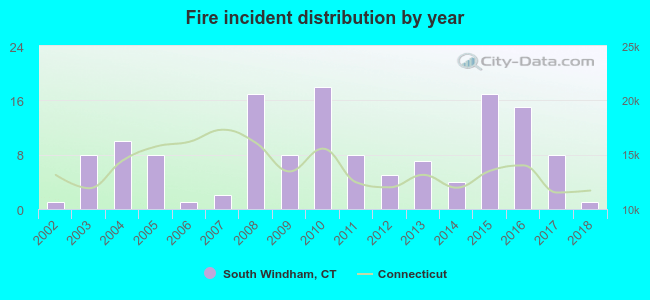 Based on the data from the years 2002 - 2018 the average number of fire incidents per year is 8. The highest number of fire incidents - 18 took place in 2010, and the least - 1 in 2002. The data has a constant trend.
 28.3% incidents where reported in the morning and 71.7% in the evening. The most fires (23.9%) took place on Wednesday, and the least (9.4%) on Tuesday.
 According to the 138 fire incidents from years 2002 - 2018 most fires (15.9%) took place during April, and the least (2.9%) in July.
 Out of all 1,120 cases reported during the years 2002 - 2018, the most belonged to the categories: Overpressure Rupture (64.4%), Fire (12.3%), and Service Call (9.1%).
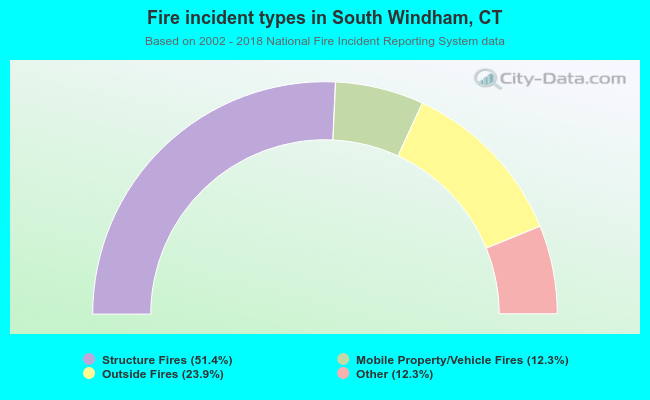 When looking into fire subcategories, the most reports belonged to: Structure Fires (51.4%), and Outside Fires (23.9%).