| Fire incidents reported |
|---|
| Sreet name | Count |
|---|
| HWY 128 | 10 | | DALLAS 208 | 6 | | DALLAS 252 | 6 | | 1483 HWY 7 NORTH | 4 | | 1616 HIGHWAY 128 | 4 | | 354 NORTH KELLY AVE | 4 | | COUNTY ROAD 206 | 4 | | DALLAS 201 | 4 | | DALLAS 203 | 4 | | EAST HORNE STREET | 4 | | PALMETTO ROAD | 4 | | SOUTH STEELE AVE | 4 | | +178 DALLAS 230 | 2 | | 101 DALLAS 203 | 2 | | 1042 HIGHWAY 128 | 2 | | 110 STATE STREET | 2 | | 113 STATE STREET | 2 | | 1160 DALLAS 208 | 2 | | 1191 HWY 7 NORTH | 2 | | 1255 HWY 7 NORTH | 2 | | 126 EAST ETHEL STREET | 2 | | 1293 HWY 7 NORTH | 2 | | 131 CROSSLEY STREET | 2 | | 133 DALLAS 253 | 2 | | 137 OLIVER AVE | 2 |
| | | Fire incidents reported |
|---|
| Sreet name | Count |
|---|
| 138 CROSSLEY STREET | 2 | | 1415 ST HWY 207 | 2 | | 1427 DALLAS 208 | 2 | | 146 NORTH WEST BOUNDARY STREET | 2 | | 156 DALLAS 235 | 2 | | 156 NORTH ARKANSAS STREET | 2 | | 1583 HWY 7 | 2 | | 167 DALLAS 214 | 2 | | 1700 DALLAS 208 | 2 | | 1750 HWY 128 | 2 | | 177 DALLAS 244 | 2 | | 178 DALLAS 230 | 2 | | 179 DALLAS 232 | 2 | | 1858 HWY 128 | 2 | | 186 EAST STATE STREET | 2 | | 2058 DALLAS 201 | 2 | | 227 BROARDWAY | 2 | | 227 SOUTH BROADWAY | 2 | | 23 DALLAS 305 | 2 | | 234 DALLAS 236 | 2 | | 236 DALLAS 208 CMN | 2 | | 2525 HWY 128 | 2 | | 259 DALLAS 253 | 2 | | 260 DALLAS 209 | 2 | | |
|
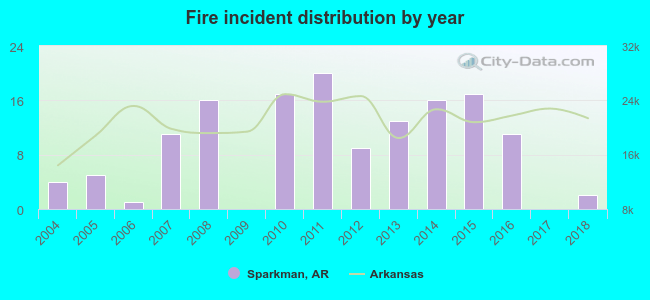 According to the data from the years 2004 - 2018 the average number of fires per year is 9. The highest number of fire incidents - 20 took place in 2011, and the least - 0 in 2009. The data has a dropping trend.
 26.8% incidents where reported in the morning and 73.2% in the evening. The most fires (18.3%) took place on Tuesday, and the least (8.5%) on Friday.
 According to the 142 fire incidents from years 2004 - 2018 most fires (12.7%) took place during October, and the least (2.8%) in May.
 Out of all 271 cases reported during the years 2004 - 2018, the most belonged to the categories: Fire (52.4%), Overpressure Rupture (43.5%), and Hazardous Condition (1.8%).
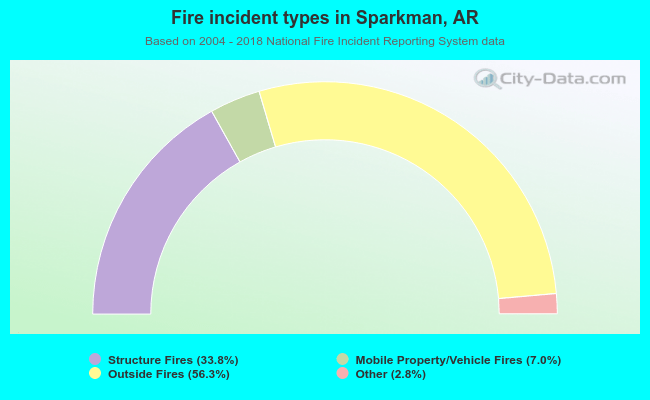 When looking into fire subcategories, the most reports belonged to: Outside Fires (56.3%), and Structure Fires (33.8%).