| Fire incidents reported |
|---|
| Sreet name | Count |
|---|
| I-75 FWY | 50 | | GOODMAN ST | 32 | | BARNEYVILLE RD | 30 | | RHONE ST | 26 | | LOVETT CIR | 22 | | SPRINGHILL CHURCH RD | 20 | | BRUSHY CREEK RD | 18 | | SOUTH AVE | 18 | | BRIARCLIFF CIR | 14 | | I-75 | 14 | | 41 HWY | 12 | | COLLEGE ST | 12 | | COLQUITT ST | 12 | | WAGON WHEEL RD | 12 | | WILLIS LN | 12 | | CLEVELAND ST | 10 | | I75 | 10 | | OVERSTREET RD | 10 | | PLEASANTDALE CIR | 10 | | ALABAMA ST | 8 | | BEULAH CHURCH RD | 8 | | COLQUIT ST | 8 | | GIBBS LN | 8 | | MARTIN LUTHER KING JR DR | 8 | | ARLENE LN | 6 |
| | | Fire incidents reported |
|---|
| Sreet name | Count |
|---|
| BARNEYVILLE | 6 | | BLESSED LN | 6 | | BROOME CT | 6 | | BRUSHY CREEK DR | 6 | | BRUSHY CREEK ROAD | 6 | | BRYAN ST | 6 | | BYRON CONNELL RD | 6 | | ED TAYLOR RD | 6 | | ELM ST | 6 | | EVERGREEN CHURCH RD | 6 | | GORDON ST | 6 | | INTERSTATE 75 | 6 | | PATTERSON ST | 6 | | SOUTH COLLEGE ST | 6 | | SUSIE MCCRANIE RD | 6 | | VIRGINIA AVE | 6 | | WASHINGTON ST | 6 | | WHITNEY DR | 6 | | WOOD RD | 6 | | ADAMS ST | 4 | | ASPEN LN | 4 | | BARNEYVILLE ROAD | 4 | | BRAIRCLIFF CIR | 4 | | BROOM CT | 4 | | COLDWELL ST | 4 |
|
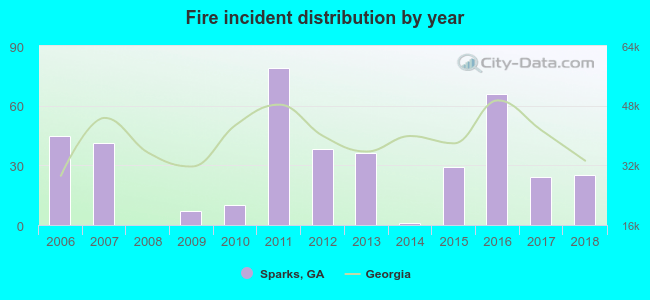 Based on the data from the years 2006 - 2018 the average number of fires per year is 31. The highest number of fires - 79 took place in 2011, and the least - 0 in 2008. The data has a decreasing trend.
 21.4% incidents where reported in the morning and 78.6% in the evening. The most fires (16.5%) took place on Friday, and the least (12.0%) on Tuesday.
 Based on the 401 fires from years 2006 - 2018 most fires (12.5%) took place during March, and the least (4.2%) in July.
 Out of all 560 cases reported during the years 2006 - 2018, the most belonged to the categories: Fire (71.6%), Hazardous Condition (9.8%), and Good Intent Call (8.9%).
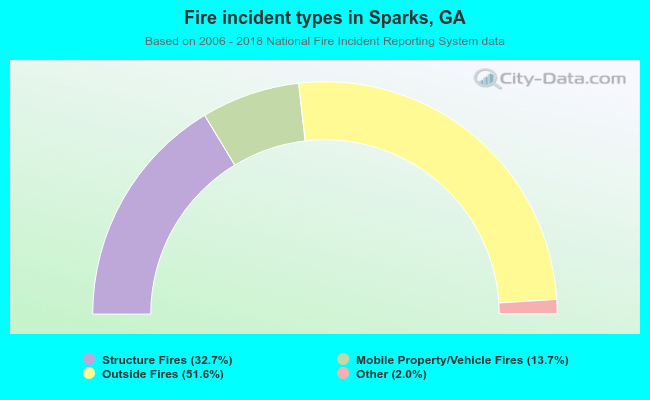 When looking into fire subcategories, the most reports belonged to: Outside Fires (51.6%), and Structure Fires (32.7%).