| Fire incidents reported |
|---|
| Sreet name | Count |
|---|
| LEE HWY | 50 | | SLATE MILLS RD | 24 | | F T VALLY RD | 22 | | LEE HWY | 18 | | SPERRYVILLE PIKE | 16 | | WOODWARD RD | 14 | | GREEN RD | 12 | | THORNTON GAP CHURCH RD | 12 | | FLETCHERS MILL RD | 10 | | OLD HOLLOW RD | 10 | | F T VALLEY RD | 8 | | MOON RD | 8 | | NETHERS RD | 8 | | SARA LN | 8 | | SISK LN | 8 | | SISK LN | 8 | | SPERRYVILLE PIKE | 8 | | WOODWARD RD | 8 | | ATKINS RD | 6 | | MAIN ST | 6 | | NETHERS RD | 6 | | OLD HOLLOW RD | 6 | | PEARL LN | 6 | | SLATE MILLS RD | 6 | | STILL HOUSE HOLLOW LN | 6 |
| | | Fire incidents reported |
|---|
| Sreet name | Count |
|---|
| ASHBY RD | 4 | | CHESTNUT RUN LN | 4 | | DEERFIELD LA | 4 | | FALLOWATER LN | 4 | | FALLOWATER LN | 4 | | FLETCHERS MILL RD | 4 | | LEE HWY. | 4 | | MAJOR BROWN DR | 4 | | MAJOR BROWN DR | 4 | | MOON RD | 4 | | OVENTOP MOUNTAIN LN | 4 | | OVENTOP MOUNTAIN LN | 4 | | PEARL LA | 4 | | PRINCESS TREE LANE | 4 | | ROLLING RD | 4 | | SHORT RD | 4 | | THORTON GAP CHURCH RD | 4 | | WOODWARD RD. | 4 | | 12270 LEE HWY. | 2 | | ANTIQUE LN | 2 | | ANTIQUE LN | 2 | | ASHBY LN | 2 | | ASHBY RD | 2 | | BARRETT LANE | 2 | | |
|
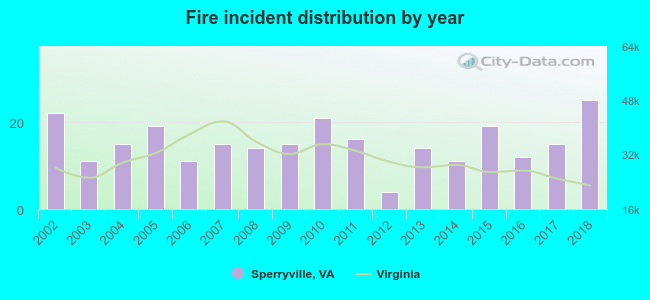 Based on the data from the years 2002 - 2018 the average number of fires per year is 15. The highest number of reported fire incidents - 25 took place in 2018, and the least - 4 in 2012. The data has a rising trend.
 30.1% incidents where reported in the morning and 69.9% in the evening. The most fires (18.9%) took place on Saturday, and the least (10.8%) on Sunday.
 According to the 259 fires from years 2002 - 2018 most fires (15.4%) took place during February, and the least (3.1%) in August.
 Out of all 1,583 cases reported during the years 2002 - 2018, the most belonged to the categories: Hazardous Condition (30.8%), Rescue & EMS (27.4%), and Good Intent Call (19.7%).
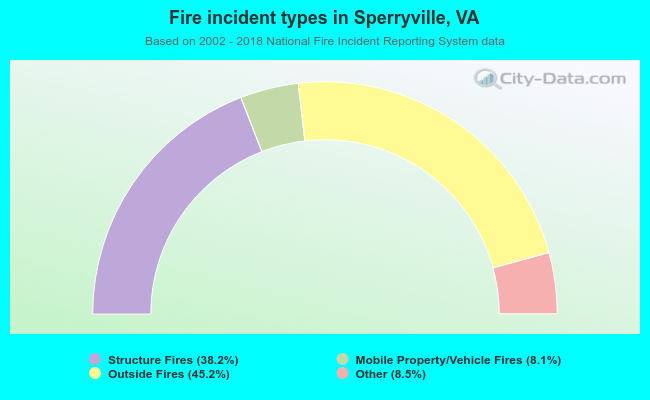 When looking into fire subcategories, the most reports belonged to: Outside Fires (45.2%), and Structure Fires (38.2%).