| Fire incidents reported |
|---|
| Sreet name | Count |
|---|
| OLD SPRAGUE HWY | 14 | | I-90 | 6 | | JACK BROWN RD | 6 | | SR 23 | 6 | | 39000 SR 23 | 4 | | DOERSCHLAG RD | 4 | | I-90 MP 243 | 4 | | I-90 MP 245 HWY | 4 | | LAKE VALLEY LOOP RD | 4 | | LAKE VALLEY LOOP RD. | 4 | | SPRAGUE HWY | 4 | | SR 231 | 4 | | STROMBERGER RD | 4 | | STROMBERGER RD. | 4 | | WILLIAMS LAKE RD | 4 | | 109 SOUTH E ST | 2 | | 2ND | 2 | | 3 MILES EAST OF SPRAGUE | 2 | | 3RD ST | 2 | | 408 NORTH ST | 2 | | 419 W THIRD ST | 2 | | 4TH JULY LAKE | 2 | | 51100 E SPRAGUE HIGHWAY | 2 | | 5TH | 2 | | 5TH ST | 2 |
| | | Fire incidents reported |
|---|
| Sreet name | Count |
|---|
| ALDER | 2 | | ALDER ST | 2 | | B AND POPLAR ST | 2 | | B ST. | 2 | | BLM GROUND NEAR HOG LAKE | 2 | | BN RAIL LINE | 2 | | BN RAILWAY | 2 | | BNSF MP 47 | 2 | | BROWN | 2 | | BROWN RD | 2 | | BROWN RD | 2 | | COLUMBIA BASIN HWY | 2 | | DAYTON ST | 2 | | DOERSCHLAG RD ST | 2 | | ESTATE RD. N | 2 | | FISH TRAP LACK | 2 | | FISHTRAP | 2 | | FISHTRAP LAKE RD | 2 | | FISHTRAP RD | 2 | | GROVES CROSSING UPRR | 2 | | HARDING FARM | 2 | | HARRIS RD | 2 | | HESIMAMON FIRE | 2 | | HIGHWAY 231 HWY | 2 | | |
|
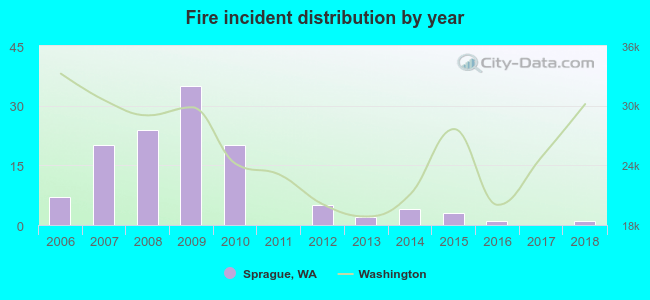 According to the data from the years 2006 - 2018 the average number of fires per year is 9. The highest number of reported fires - 35 took place in 2009, and the least - 0 in 2011. The data has a declining trend.
 21.3% incidents where reported in the morning and 78.7% in the evening. The most fires (18.0%) took place on Saturday, and the least (7.4%) on Monday.
 According to the 122 fires from years 2006 - 2018 most fires (18.9%) took place during August, and the least (2.5%) in December.
 Out of all 139 cases reported during the years 2006 - 2018, the most belonged to the categories: Fire (87.8%), Rescue & EMS (7.9%), and Service Call (2.9%).
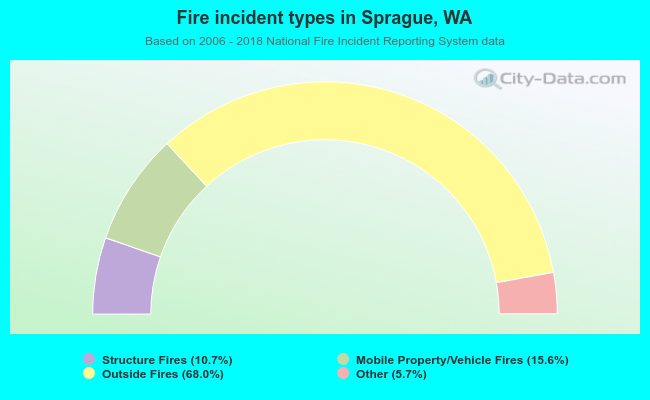 When looking into fire subcategories, the most incidents belonged to: Outside Fires (68.0%), and Mobile Property/Vehicle Fires (15.6%).