Springfield: Fire Incidents, Missouri (MO)
Where are fire incidents reported in Springfield, MO
Something went wrong! Please refresh the page.
| Fire incidents reported | |
|---|---|
| Sreet name | Count |
| GLENSTONE AVE | 916 |
| CAMPBELL AVE | 764 |
| KEARNEY ST | 618 |
| SUNSHINE ST | 596 |
| CHESTNUT EXPY | 516 |
| DIVISION ST | 512 |
| BATTLEFIELD RD | 504 |
| NATIONAL AVE | 468 |
| GRANT AVE | 458 |
| JEFFERSON AVE | 344 |
| KANSAS EXPY | 344 |
| WALNUT ST | 336 |
| GRAND ST | 334 |
| ELM ST | 324 |
| COMMERCIAL ST | 322 |
| CHERRY ST | 318 |
| SCENIC AVE | 300 |
| BROADWAY AVE | 286 |
| FORT AVE | 278 |
| NICHOLS ST | 272 |
| MADISON ST | 256 |
| MOUNT VERNON ST | 256 |
| GOLDEN AVE | 252 |
| INGRAM MILL RD | 242 |
| MAIN AVE | 242 |
| FREMONT AVE | 238 |
| I44 | 236 |
| COLLEGE ST | 234 |
| BENNETT ST | 228 |
| HILLCREST AVE | 212 |
| Other | 5,582 |
2002 - 2018 National Fire Incident Reporting System (NFIRS) incidents
- Incident types reported to NFIRS in Springfield, MO
- 52,69545.1%Rescue & EMS
- 23,29319.9%Good Intent Call
- 16,78814.4%Fire
- 9,3368.0%Service Call
- 7,2626.2%False Alarm
- 7,1996.2%Hazardous Condition
- 2040.2%Overpressure Rupture
- 1200.1%Special Incident
- Fire incident types reported to NFIRS in Springfield, MO
- 7,70845.9%Outside Fires
- 5,61333.4%Structure Fires
- 2,61415.6%Mobile Property/Vehicle Fires
- 8535.1%Other
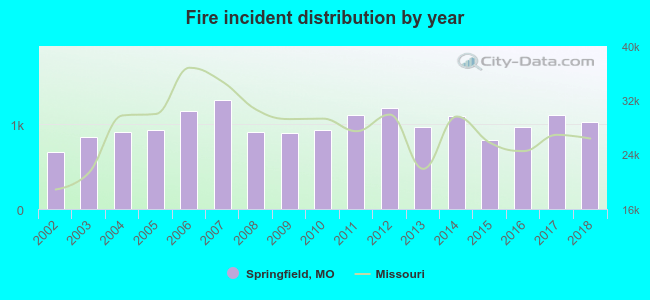 Based on the data from the years 2002 - 2018 the average number of fire incidents per year is 988. The highest number of fire incidents - 1,279 took place in 2007, and the least - 669 in 2002. The data has a growing trend.
The average number of yearly fire incidents per 10k residents in Springfield, MO compared to nearest cities:
(Note: Based on data for the last 3 years, including only cities with population 5,000 and above)
| Springfield: | 62.5 |
| Battlefield: | 47.3 |
| Willard: | 113.1 |
| Nixa: | 43.6 |
| Republic: | 40.2 |
| Ozark: | 74.5 |
| Marshfield: | 109.9 |
| Aurora: | 23.3 |
| Bolivar: | 43.2 |
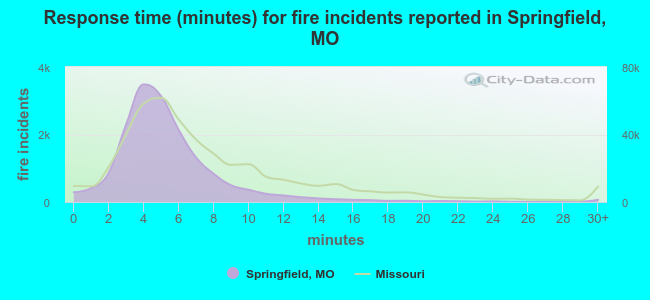 The median response time based on all reported fire incidents is 5 minutes. This is lower compared to the Missouri median value.
The median response time in Springfield, MO compared to nearest cities:
(Note: Based on data for all years, including only cities with at least 500 fire incidents)
| Springfield: | 5 minutes |
| Battlefield: | 6 minutes |
| Willard: | 10 minutes |
| Nixa: | 6 minutes |
| Strafford: | 9 minutes |
| Republic: | 4 minutes |
| Ozark: | 8 minutes |
| Rogersville: | 8 minutes |
| Fair Grove: | 10 minutes |
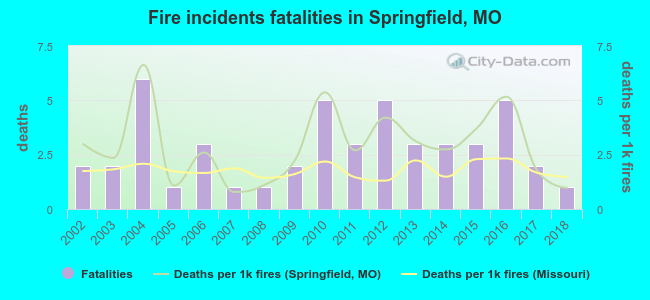 According to the data from the years 2002 - 2018 the average number of fire-related fatalities per year is 3. The highest number of deaths - 6 took place in 2004, and the lowest - 1 in 2005. The data has a dropping trend.
The average number of fatalities per 1,000 fires is 3. This indicator was the highest - 7 in 2004, and the lowest 1 in 2007. The trend for fatalities per 1,000 fires is dropping. Compared to the Missouri value the number of deaths per 1,000 incidents is higher.
According to the data from the years 2002 - 2018 the average number of fire-related fatalities per year is 3. The highest number of deaths - 6 took place in 2004, and the lowest - 1 in 2005. The data has a dropping trend.
The average number of fatalities per 1,000 fires is 3. This indicator was the highest - 7 in 2004, and the lowest 1 in 2007. The trend for fatalities per 1,000 fires is dropping. Compared to the Missouri value the number of deaths per 1,000 incidents is higher.Deaths per 1,000 incidents in Springfield, MO compared to nearest cities:
(Note: Based on data for all years, including only cities with at least 2,500 fire incidents)
| Springfield: | 2.9 |
| Ozark: | 0.3 |
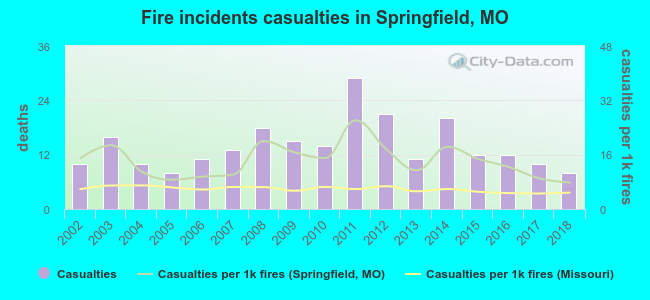 Based on the data from the years 2002 - 2018 the average number of fire-related casualties per year is 14. The highest number of injuries - 29 took place in 2011, and the lowest - 8 in 2005. The data has a decreasing trend.
The average number of injuries per 1,000 fires is 14. This indicator was the highest - 26 in 2011, and the lowest 8 in 2018. The trend for casualties per 1,000 fires is decreasing. Compared to the Missouri value the number of casualties per 1,000 fires is much higher.
Based on the data from the years 2002 - 2018 the average number of fire-related casualties per year is 14. The highest number of injuries - 29 took place in 2011, and the lowest - 8 in 2005. The data has a decreasing trend.
The average number of injuries per 1,000 fires is 14. This indicator was the highest - 26 in 2011, and the lowest 8 in 2018. The trend for casualties per 1,000 fires is decreasing. Compared to the Missouri value the number of casualties per 1,000 fires is much higher.Casualties per 1,000 incidents in Springfield, MO compared to nearest cities:
(Note: Based on data for all years, including only cities with at least 500 fire incidents)
| Springfield: | 14.2 |
| Battlefield: | 7.1 |
| Willard: | 5.9 |
| Nixa: | 4.9 |
| Strafford: | 0.0 |
| Republic: | 6.9 |
| Ozark: | 1.4 |
| Rogersville: | 3.5 |
| Fair Grove: | 0.0 |
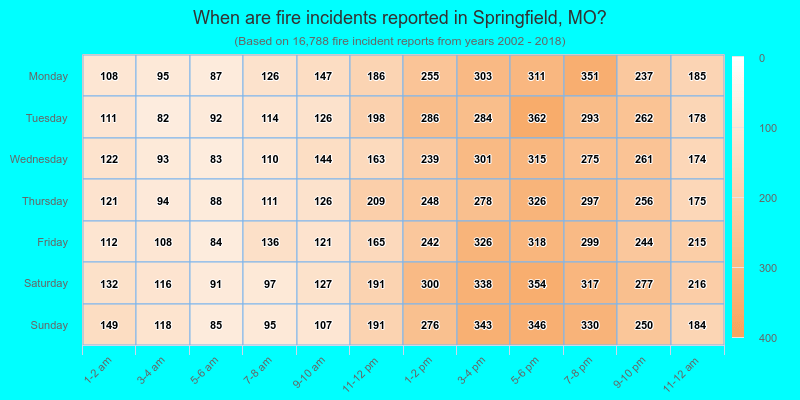
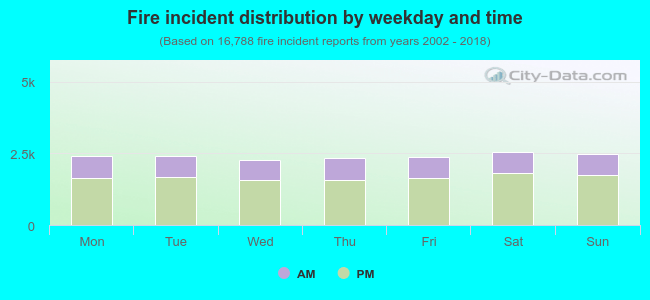 30.7% incidents where reported in the morning and 69.3% in the evening. The most fires (15.2%) took place on Saturday, and the least (13.6%) on Wednesday.
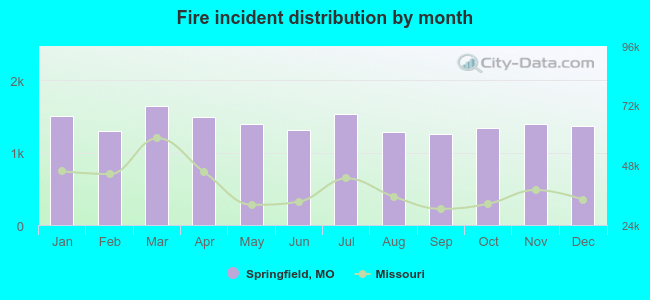 According to the 16,788 fire incidents from years 2002 - 2018 most fires (9.8%) took place during March, and the least (7.5%) in September.
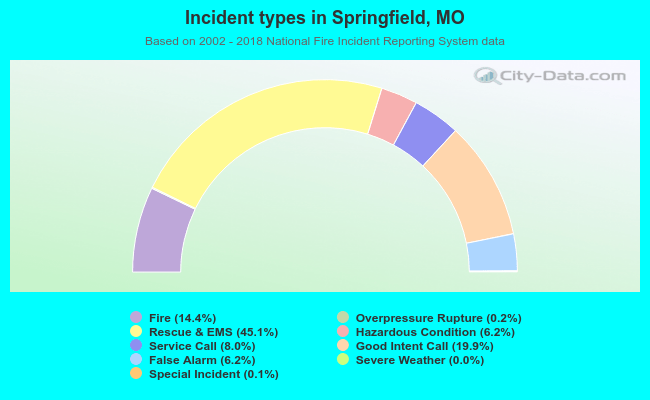 Out of all 116,946 cases reported during the years 2002 - 2018, the most belonged to the categories: Rescue & EMS (45.1%), Good Intent Call (19.9%), and Fire (14.4%).
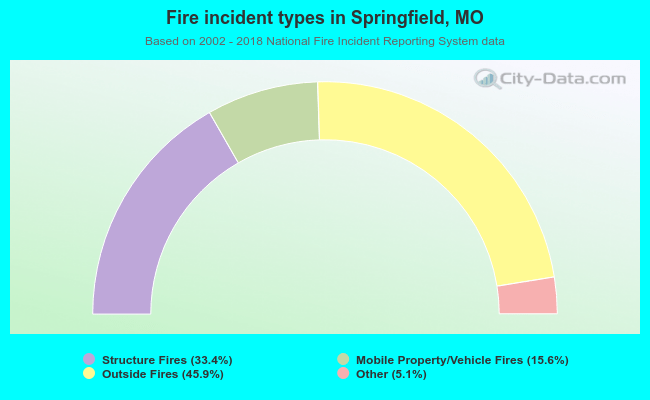 When looking into fire subcategories, the most incidents belonged to: Outside Fires (45.9%), and Structure Fires (33.4%).