Springtown: Fire Incidents, Texas (TX)
Where are fire incidents reported in Springtown, TX
Something went wrong! Please refresh the page.
|
| |||||||||||||||||||||||||||||||||||||||||||||||||||||||||||||||||||||||||||||||||||||||||||||||||||||||||||||
| Other | 1,843 | |||||||||||||||||||||||||||||||||||||||||||||||||||||||||||||||||||||||||||||||||||||||||||||||||||||||||||||
2002 - 2018 National Fire Incident Reporting System (NFIRS) incidents
- Incident types reported to NFIRS in Springtown, TX
- 3,31129.9%Fire
- 2,39021.6%Rescue & EMS
- 2,33721.1%Hazardous Condition
- 1,71315.5%Service Call
- 1,16410.5%Good Intent Call
- 890.8%False Alarm
- 610.6%Severe Weather
- 150.1%Special Incident
- Fire incident types reported to NFIRS in Springtown, TX
- 1,94058.6%Outside Fires
- 1,01530.7%Structure Fires
- 2126.4%Mobile Property/Vehicle Fires
- 1444.3%Other
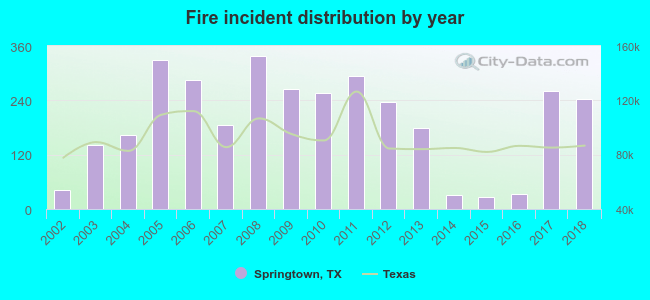 According to the data from the years 2002 - 2018 the average number of fires per year is 195. The highest number of fires - 338 took place in 2008, and the least - 27 in 2015. The data has a rising trend.
 The median response time based on all reported fire incidents is 9 minutes. This is higher compared to the state median value.
The median response time in Springtown, TX compared to nearest cities:
(Note: Based on data for all years, including only cities with at least 500 fire incidents)
| Springtown: | 9 minutes |
| Azle: | 9 minutes |
| Boyd: | 12 minutes |
| Newark: | 8 minutes |
| Paradise: | 10 minutes |
| Rhome: | 10 minutes |
| Willow Park: | 5 minutes |
| Weatherford: | 9 minutes |
| Bridgeport: | 10 minutes |
 25.1% incidents where reported in the morning and 74.9% in the evening. The most fires (16.7%) took place on Saturday, and the least (12.5%) on Thursday.
 According to the 3,311 incident reports from years 2002 - 2018 most fires (13.4%) took place during January, and the least (5.5%) in October.
 Out of all 11,085 cases reported during the years 2002 - 2018, the most belonged to the categories: Fire (29.9%), Rescue & EMS (21.6%), and Hazardous Condition (21.1%).
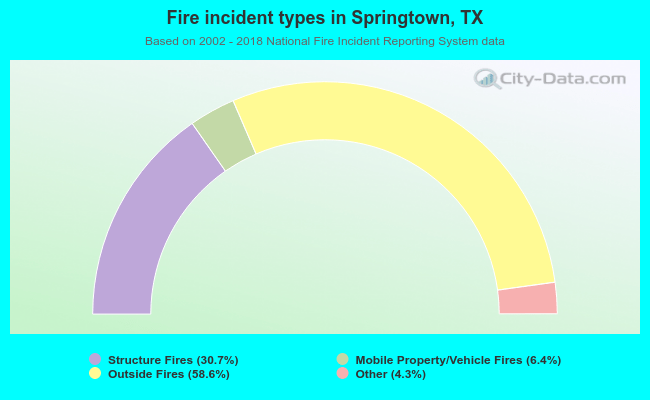 When looking into fire subcategories, the most incidents belonged to: Outside Fires (58.6%), and Structure Fires (30.7%).