St. Clair Shores: Fire Incidents, Michigan (MI)
Where are fire incidents reported in St. Clair Shores, MI
Something went wrong! Please refresh the page.
| Fire incidents reported | |
|---|---|
| Sreet name | Count |
| HARPER | 202 |
| JEFFERSON | 168 |
| 9 MILE | 68 |
| GREATER MACK | 60 |
| LITTLE MACK | 54 |
| CALIFORNIA | 40 |
| 12 MILE | 36 |
| MAXINE | 36 |
| ARDMORE | 30 |
| STEPHENS | 26 |
| 11 MILE | 24 |
| 13 MILE | 22 |
| ELMIRA | 22 |
| FRAZHO | 22 |
| MASONIC | 22 |
| WINTON | 22 |
| CHAPOTON | 20 |
| EB I 94 | 20 |
| I 94 EAST BOUND | 20 |
| PLEASANT | 20 |
| ROSEDALE | 20 |
| URSULINE | 20 |
| 10 MILE | 18 |
| ARROWHEAD | 18 |
| BON HEUR | 18 |
| DEZIEL | 18 |
| SOCIA | 18 |
| HARPER LAKE | 16 |
| MARTER | 16 |
| ST GERTRUDE | 16 |
| Other | 17 |
2002 - 2011 National Fire Incident Reporting System (NFIRS) incidents
- Incident types reported to NFIRS in St. Clair Shores, MI
- 2,68738.1%Hazardous Condition
- 1,55122.0%Rescue & EMS
- 1,12916.0%Fire
- 6929.8%Service Call
- 4656.6%False Alarm
- 4456.3%Good Intent Call
- 410.6%Overpressure Rupture
- 390.6%Special Incident
- Fire incident types reported to NFIRS in St. Clair Shores, MI
- 42637.7%Structure Fires
- 29826.4%Outside Fires
- 23821.1%Mobile Property/Vehicle Fires
- 16714.8%Other
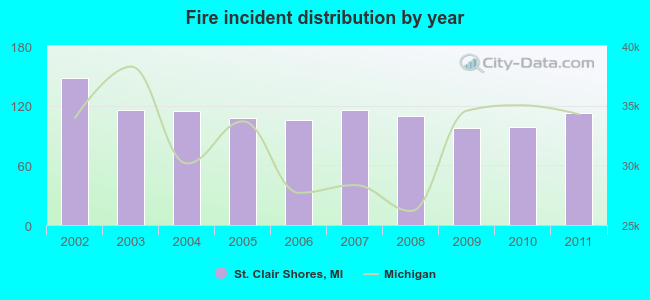 According to the data from the years 2002 - 2011 the average number of fire incidents per year is 113. The highest number of fires - 148 took place in 2002, and the least - 98 in 2009. The data has a decreasing trend.
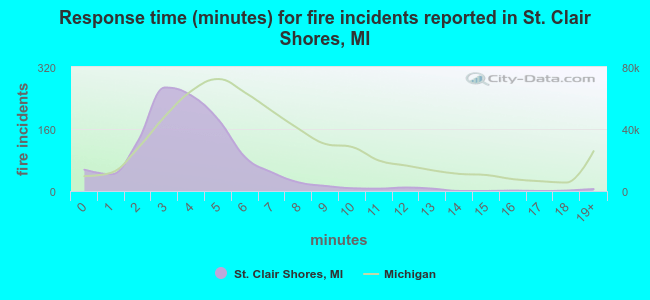 The median response time based on all reported fire incidents is 4 minutes. This is lower than the state median value.
The median response time in St. Clair Shores, MI compared to nearest cities:
(Note: Based on data for all years, including only cities with at least 500 fire incidents)
| St. Clair Shores: | 4 minutes |
| Roseville: | 4 minutes |
| Eastpointe: | 4 minutes |
| Harper Woods: | 3 minutes |
| Warren: | 5 minutes |
| Center Line: | 3 minutes |
| Mount Clemens: | 3 minutes |
| Sterling Heights: | 5 minutes |
| Hamtramck: | 3 minutes |
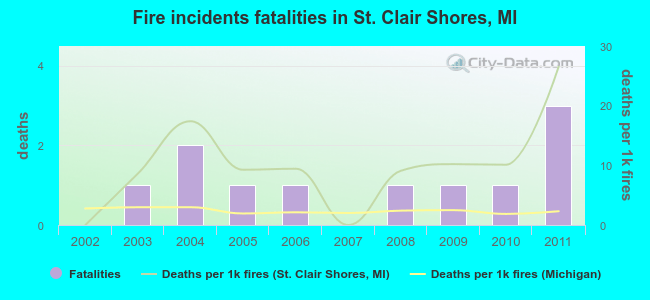 According to the data from the years 2002 - 2011 the average number of fire-related fatalities per year is 1. The highest number of deaths - 3 took place in 2011, and the lowest - 0 in 2002. The data has a rising trend.
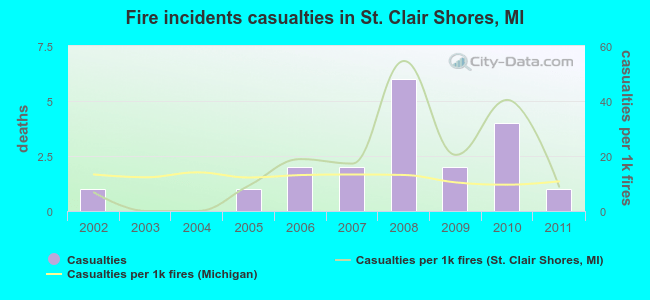 According to the reports from the years 2002 - 2011 the average number of fire-related casualties per year is 2. The highest number of reported injuries - 6 took place in 2008, and the lowest - 0 in 2003. The data has a constant trend.
The average number of injuries per 1,000 fires is 18. This indicator was the highest - 55 in 2008, and the lowest 0 in 2003. The trend for injuries per 1,000 fires is increasing. Compared to the state value the number of casualties per 1,000 fire incidents is higher.
According to the reports from the years 2002 - 2011 the average number of fire-related casualties per year is 2. The highest number of reported injuries - 6 took place in 2008, and the lowest - 0 in 2003. The data has a constant trend.
The average number of injuries per 1,000 fires is 18. This indicator was the highest - 55 in 2008, and the lowest 0 in 2003. The trend for injuries per 1,000 fires is increasing. Compared to the state value the number of casualties per 1,000 fire incidents is higher.Casualties per 1,000 incidents in St. Clair Shores, MI compared to nearest cities:
(Note: Based on data for all years, including only cities with at least 500 fire incidents)
| St. Clair Shores: | 16.8 |
| Roseville: | 12.8 |
| Eastpointe: | 29.7 |
| Harper Woods: | 10.9 |
| Warren: | 24.1 |
| Center Line: | 31.9 |
| Mount Clemens: | 8.5 |
| Sterling Heights: | 49.4 |
| Hamtramck: | 2.4 |
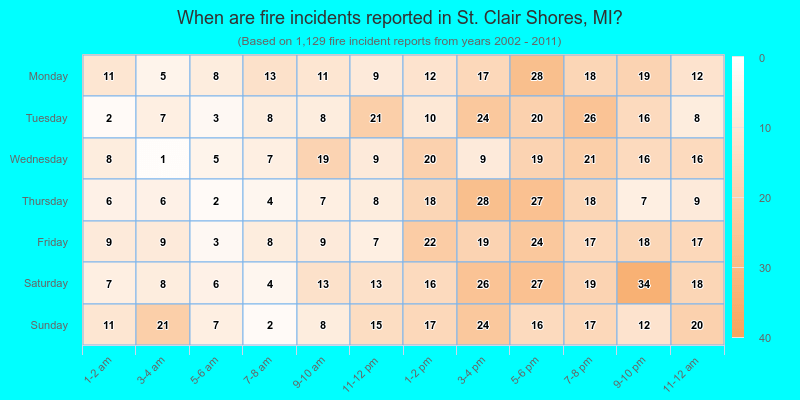
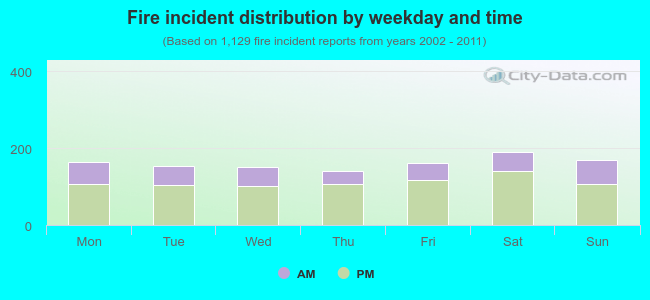 30.8% incidents where reported in the morning and 69.2% in the evening. The most fires (16.9%) took place on Saturday, and the least (12.4%) on Thursday.
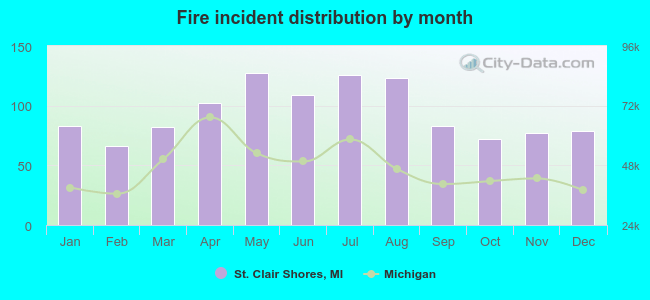 According to the 1,129 reports from years 2002 - 2011 most fires (11.2%) took place during May, and the least (5.8%) in February.
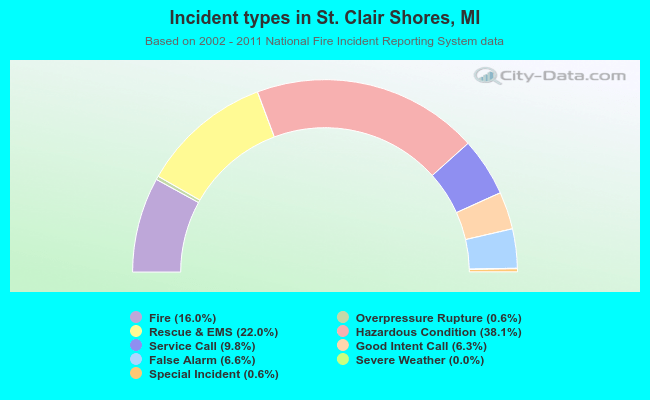 Out of all 7,052 cases reported during the years 2002 - 2011, the most belonged to the categories: Hazardous Condition (38.1%), Rescue & EMS (22.0%), and Fire (16.0%).
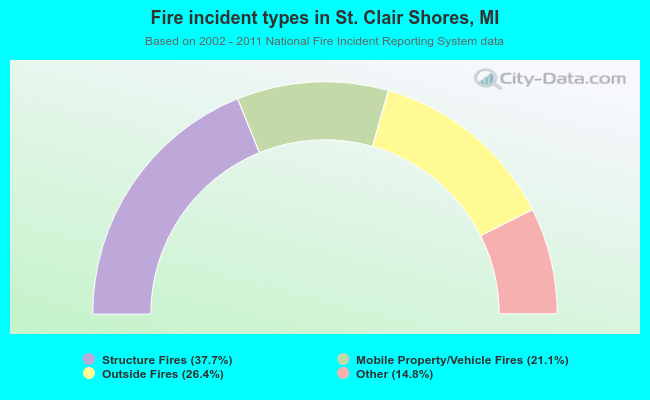 When looking into fire subcategories, the most incidents belonged to: Structure Fires (37.7%), and Outside Fires (26.4%).