St. Johnsville: Fire Incidents, New York (NY)
Where are fire incidents reported in St. Johnsville, NY
Something went wrong! Please refresh the page.
|
| |||||||||||||||||||||||||||||||||||||||||||||||||||||||||||||||||||||||||||||||||||||||||||||||||||||||||||||
2002 - 2011 National Fire Incident Reporting System (NFIRS) incidents
- Incident types reported to NFIRS in St. Johnsville, NY
- 16241.0%Fire
- 15539.2%Hazardous Condition
- 215.3%Rescue & EMS
- 194.8%Service Call
- 184.6%Good Intent Call
- 184.6%False Alarm
- 10.3%Overpressure Rupture
- 10.3%Severe Weather
- Fire incident types reported to NFIRS in St. Johnsville, NY
- 8854.3%Structure Fires
- 4527.8%Outside Fires
- 2616.0%Mobile Property/Vehicle Fires
- 31.9%Other
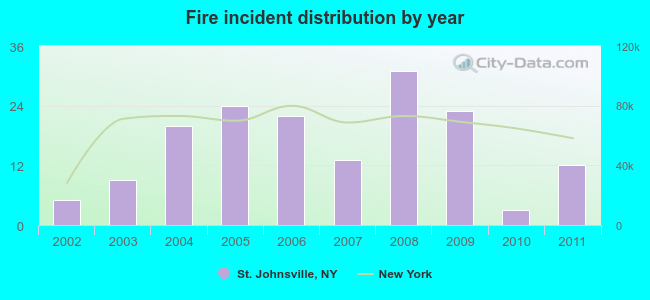 Based on the data from the years 2002 - 2011 the average number of fire incidents per year is 16. The highest number of fires - 31 took place in 2008, and the least - 3 in 2010. The data has a rising trend.
 Based on the reports from the years 2002 - 2011 the average number of fire-related yearly casualties is 1. The highest number of casualties - 3 took place in 2006, and the lowest - 0 in 2002. The data has a constant trend.
 30.9% incidents where reported in the morning and 69.1% in the evening. The most fires (19.8%) took place on Friday, and the least (10.5%) on Monday.
 According to the 162 incident reports from years 2002 - 2011 most fires (19.1%) took place during April, and the least (4.9%) in July.
 Out of all 395 cases reported during the years 2002 - 2011, the most belonged to the categories: Fire (41.0%), Hazardous Condition (39.2%), and Rescue & EMS (5.3%).
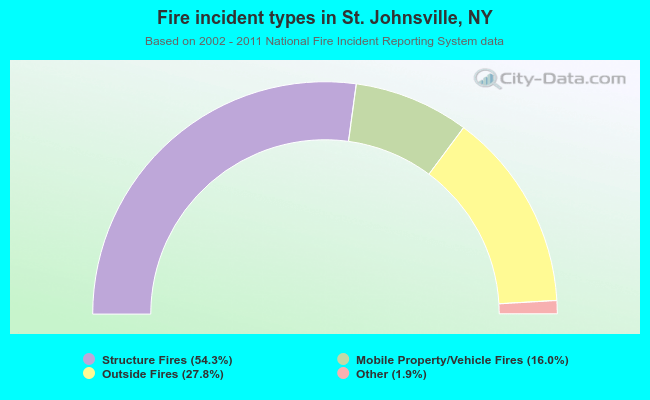 When looking into fire subcategories, the most reports belonged to: Structure Fires (54.3%), and Outside Fires (27.8%).