St. Louisville: Fire Incidents, Ohio (OH)
Where are fire incidents reported in St. Louisville, OH
Something went wrong! Please refresh the page.
|
| |||||||||||||||||||||||||||||||||||||||||||||||||||||||||||||||||||||||||||||||||||||||||||||||||||||||||||||
2002 - 2011 National Fire Incident Reporting System (NFIRS) incidents
- Incident types reported to NFIRS in St. Louisville, OH
- 22958.9%Fire
- 7719.8%Hazardous Condition
- 297.5%Rescue & EMS
- 225.7%False Alarm
- 205.1%Service Call
- 112.8%Good Intent Call
- 10.3%Overpressure Rupture
- Fire incident types reported to NFIRS in St. Louisville, OH
- 13559.0%Structure Fires
- 5825.3%Outside Fires
- 208.7%Mobile Property/Vehicle Fires
- 167.0%Other
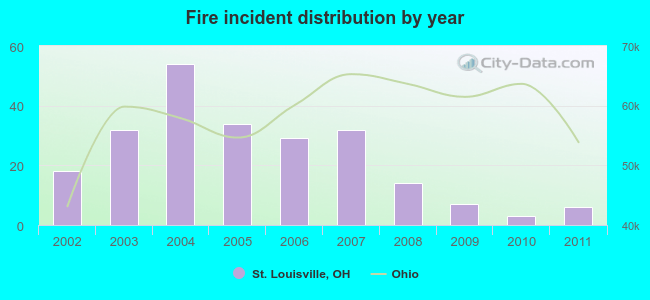 According to the data from the years 2002 - 2011 the average number of fire incidents per year is 23. The highest number of reported fire incidents - 54 took place in 2004, and the least - 3 in 2010. The data has a declining trend.
 35.8% incidents where reported in the morning and 64.2% in the evening. The most fires (18.3%) took place on Saturday, and the least (11.4%) on Wednesday.
 According to the 229 fire incident reports from years 2002 - 2011 most fires (14.0%) took place during April, and the least (2.6%) in September.
 Out of all 389 cases reported during the years 2002 - 2011, the most belonged to the categories: Fire (58.9%), Hazardous Condition (19.8%), and Rescue & EMS (7.5%).
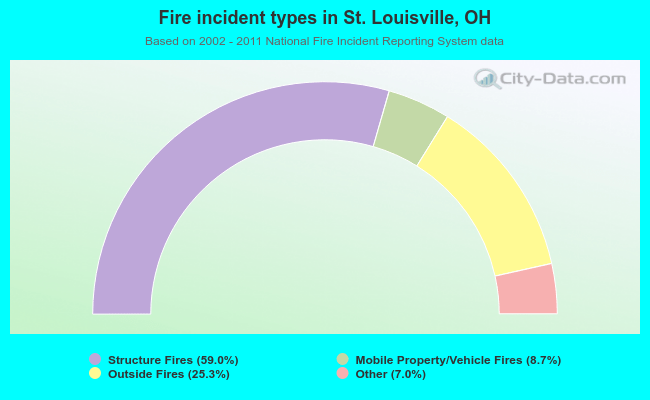 When looking into fire subcategories, the most reports belonged to: Structure Fires (59.0%), and Outside Fires (25.3%).