| Fire incidents reported |
|---|
| Sreet name | Count |
|---|
| 650 NORTH | 14 | | I 74 129 MILE MARKER | 12 | | 421 | 10 | | I 74 M.M. 128 | 10 | | I-74 125 MM | 10 | | MAIN ST. | 10 | | I-74 126 MM | 8 | | 5577 650N | 6 | | CONGER ST. | 6 | | COUNTY LINE RD | 6 | | FRANKLIN ST | 6 | | FRANKLIN ST. | 6 | | I 74 M.M. 127 | 6 | | I-74 EAST BOUND 124 | 6 | | PIERCE ST. | 6 | | US HWY 421 | 6 | | WASHINGTON | 6 | | 103 N WEBSTER ST. | 4 | | 108 EAST SCHOOL ST. | 4 | | 110 EAST WASHINGTON | 4 | | 201 PERAL ST. | 4 | | 203 N JACKSON | 4 | | 208RIVER BEND | 4 | | 4307 E VANDILLA RD | 4 | | 450 NORTH | 4 |
| | | Fire incidents reported |
|---|
| Sreet name | Count |
|---|
| 450 WEST | 4 | | 500 SOUTH | 4 | | 550 SOUTH | 4 | | 6598 W 650 N | 4 | | 7644 N CO LINE RD. | 4 | | 7967 N 421 | 4 | | 800 EAST | 4 | | I 74 MM 121 | 4 | | I 74 MM 122 | 4 | | I-74 124 MM | 4 | | I-74 M.M. 123 | 4 | | MAIN ST | 4 | | MOUND RD | 4 | | VANDALIA RD | 4 | | 102 S WEBSTER ST | 2 | | 103 W PEARL ST. | 2 | | 1050 SOUTH | 2 | | 106 N WEBSTER | 2 | | 108 SOUTH CO. LINE RD. | 2 | | 109 S COUNTY LINE RD | 2 | | 1100 S 750 E. | 2 | | 118 S PICERSE ST | 2 | | 1250 E 500 S | 2 | | 1397 S 600EAST | 2 | | |
|
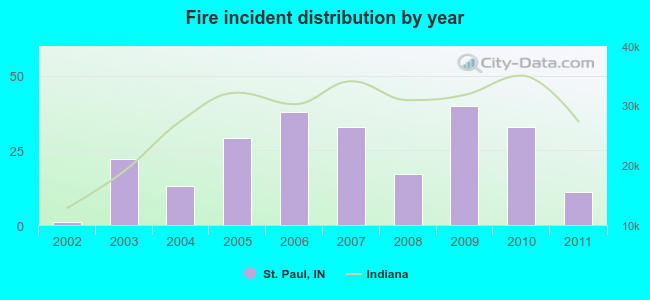 Based on the data from the years 2002 - 2011 the average number of fires per year is 24. The highest number of fire incidents - 40 took place in 2009, and the least - 1 in 2002. The data has a growing trend.
 23.6% incidents where reported in the morning and 76.4% in the evening. The most fires (17.3%) took place on Sunday, and the least (12.2%) on Monday.
 According to the 237 fire incidents from years 2002 - 2011 most fires (13.9%) took place during March, and the least (4.6%) in February.
 Out of all 344 cases reported during the years 2002 - 2011, the most belonged to the categories: Fire (68.9%), Overpressure Rupture (15.4%), and Hazardous Condition (7.6%).
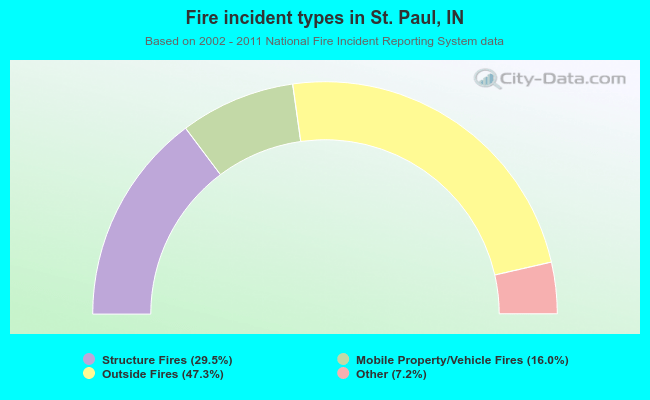 When looking into fire subcategories, the most incidents belonged to: Outside Fires (47.3%), and Structure Fires (29.5%).