| Fire incidents reported |
|---|
| Sreet name | Count |
|---|
| LAFAYETTE 27 | 20 | | LAFAYETTE 28 | 16 | | LAFAYETTE 31 | 12 | | STATE HIGHWAY 53 SOUTH | 10 | | 213 LAFAYETTE 36 | 8 | | ELLIS STREET | 8 | | LAFAYETTE 126 | 8 | | LAFAYETTE 21 | 8 | | PERSIMMON STREET | 8 | | WEST FIRST STREET | 8 | | FIRST STREET | 6 | | LAFAYETTE 24 | 6 | | LAFAYETTE 81 | 6 | | SCHOOL STREET | 6 | | SKELLY ROAD | 6 | | 1046 BERRY | 4 | | 105 ELM STREET | 4 | | 1093 LAFAYETTE 27 | 4 | | 116 GUM STREET | 4 | | 122 MAIN STREET | 4 | | 184 LAFAYETTE 126 | 4 | | 438 ASH STREET | 4 | | 443 LAFAYETTE 35 | 4 | | 601 PINE STREET | 4 | | 625 WEST FIRST STREET | 4 |
| | | Fire incidents reported |
|---|
| Sreet name | Count |
|---|
| 750 LAFAYETTE 27 | 4 | | 902 BUCHANAN | 4 | | CEDAR STREET | 4 | | COLUMBIA 1 | 4 | | FULLER MILL ROAD | 4 | | LAFAYETTE 26 | 4 | | LAFAYETTE 34 | 4 | | LAFAYETTE 36 | 4 | | POND ROAD | 4 | | US HIGHWAY 82 | 4 | | US HIGHWAY 82 EAST OF STAMPS | 4 | | WALKER STREET | 4 | | #1 WORTHEN | 2 | | 1 FULLER ROAD | 2 | | 100 NORTH OPERA STREET | 2 | | 100 THOMAS STREET | 2 | | 1001 OPERA STREET | 2 | | 1003 NORTH OPERA | 2 | | 1007 OAK GROVE ROAD | 2 | | 1008 N OPERA STREET | 2 | | 1009 THERALD BLACK DRIVE | 2 | | 101 LAFAYETTE 118 | 2 | | 1019 NORTH CENTRAL AVENUE | 2 | | 106 CHESTNUT STREET | 2 | | |
|
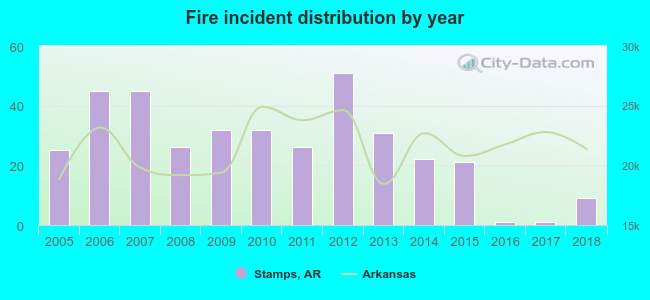 According to the data from the years 2005 - 2018 the average number of fires per year is 26. The highest number of fire incidents - 51 took place in 2012, and the least - 1 in 2016. The data has a dropping trend.
 32.2% incidents where reported in the morning and 67.8% in the evening. The most fires (16.3%) took place on Thursday, and the least (11.4%) on Tuesday.
 According to the 367 fire incidents from years 2005 - 2018 most fires (12.5%) took place during August, and the least (5.2%) in December.
 Out of all 390 cases reported during the years 2005 - 2018, the most belonged to the categories: Fire (94.1%), Good Intent Call (2.1%), and Hazardous Condition (1.5%).
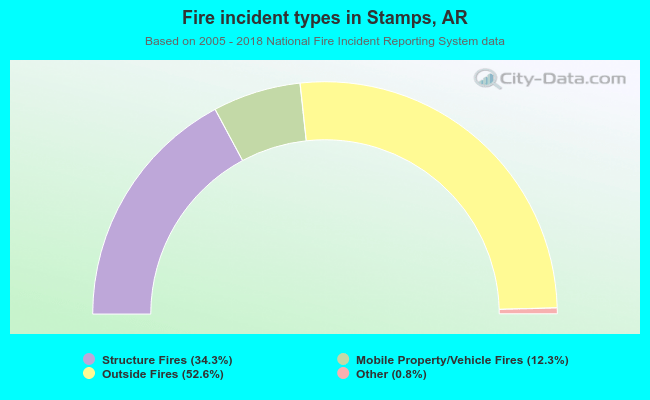 When looking into fire subcategories, the most reports belonged to: Outside Fires (52.6%), and Structure Fires (34.3%).