| Fire incidents reported |
|---|
| Sreet name | Count |
|---|
| 4887 W 825 S | 8 | | 800 S US 35 | 8 | | 2304 E DIVISION ST | 6 | | 8503 S 450 W | 6 | | 900 S 200 E | 6 | | 900 S WEST OF US 35 | 6 | | 1100 N EAST OF 119 | 4 | | 3297 W 550 S | 4 | | 3425 N 450 W | 4 | | 3729 E 300 S | 4 | | 3910 W 750 S | 4 | | 4232 S 325 E | 4 | | 450 S 475 E | 4 | | 4792 E 550 S | 4 | | 5063 S. SR 119 | 4 | | 5570 S. MAIN PULASKI | 4 | | 5724 S NICHOLS ST | 4 | | 600 S 455 E | 4 | | 6600 S 600 E | 4 | | 750 S 100 E | 4 | | 8022 S 450 W | 4 | | 8355 S 450 W | 4 | | 8692 S 475 W | 4 | | 9607 S EZRA LANE | 4 | | FIRE STATION | 4 |
| | | Fire incidents reported |
|---|
| Sreet name | Count |
|---|
| 0100 W 775 S | 2 | | 1000 N | 2 | | 1039 N ROCK RIDGE RD | 2 | | 10392 E 900 S | 2 | | 1100 W 625 S | 2 | | 1189 S 75 W | 2 | | 119 100 W | 2 | | 123 EAST PEARL ST | 2 | | 1234 S 50 E | 2 | | 1240 E 900 S | 2 | | 1300E 700N | 2 | | 1328 E 315 S | 2 | | 1335 E 315 S | 2 | | 1412 E 315 S | 2 | | 150 S SR 119 | 2 | | 1520 W SR 119 | 2 | | 1530 E 950 S | 2 | | 1600 S US 35 | 2 | | 1837 E 900 S | 2 | | 1882 E 750 S | 2 | | 1965 W 400 S | 2 | | 200 E 1000 S | 2 | | 200 W 400 S | 2 | | 2035 S SR 119 | 2 | | |
|
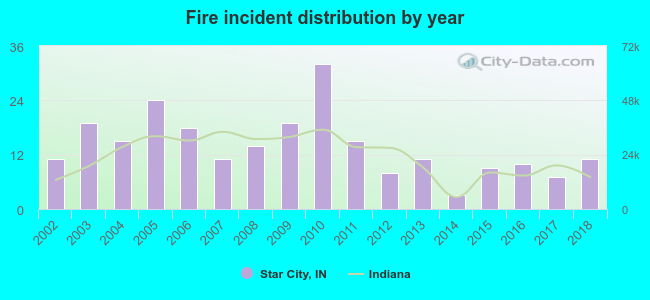 Based on the data from the years 2002 - 2018 the average number of fires per year is 14. The highest number of fire incidents - 32 took place in 2010, and the least - 3 in 2014. The data has a constant trend.
 25.7% incidents where reported in the morning and 74.3% in the evening. The most fires (20.7%) took place on Sunday, and the least (11.4%) on Tuesday.
 According to the 237 reports from years 2002 - 2018 most fires (14.8%) took place during April, and the least (5.1%) in August.
 Out of all 550 cases reported during the years 2002 - 2018, the most belonged to the categories: Overpressure Rupture (46.4%), Fire (43.1%), and Rescue & EMS (5.5%).
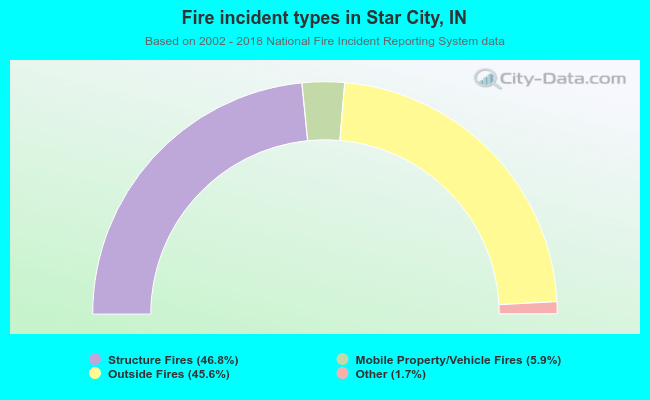 When looking into fire subcategories, the most reports belonged to: Structure Fires (46.8%), and Outside Fires (45.6%).