| Fire incidents reported |
|---|
| Sreet name | Count |
|---|
| HWY 12 | 22 | | OLD RIVER RD | 20 | | HWY 109 NORTH | 18 | | GREEN MOORE RD | 16 | | GILLIS RD | 10 | | GREEN ISLAND | 10 | | HWY 109 | 8 | | HWY 109 S | 8 | | ROBERT CLARK RD | 8 | | ALLIGATOR PARK RD | 6 | | BIG WOODS RD | 6 | | GREEN MOORE RD | 6 | | HIGHWAY 12 | 6 | | HWY 109 N | 6 | | STARKS | 6 | | WILLIE HYATT | 6 | | 109 | 4 | | 325 GREEN MOORE ROAD | 4 | | 5304 GILLIS ROAD | 4 | | ALIGATOR PARK ROAD | 4 | | ALLIGATOR PARK | 4 | | ASHWORTH CUTOFF | 4 | | BIGWOODS RD | 4 | | BUDDY JOHNSON | 4 | | BUDDYJOHNSON RD | 4 |
| | | Fire incidents reported |
|---|
| Sreet name | Count |
|---|
| CHURCH ST | 4 | | E J SIMON RD | 4 | | FOUNTAIN CEMETERY RD | 4 | | GIBSON LP | 4 | | GILLIS ROAD | 4 | | GREEN ISLAND RD | 4 | | GREEN MOORE ROAD | 4 | | HIGHWAY 109 N | 4 | | HIGHWAY 109 NORTH | 4 | | HINER RD | 4 | | HOWARD RD | 4 | | HOWARD ROAD | 4 | | HWY 12 EAST | 4 | | JIM DRAKE RD | 4 | | OLD RIVER ROAD | 4 | | RH BLANCHARD RD | 4 | | 100 LEWIS STATUM ROAD | 2 | | 108 OLD RIVER ROAD | 2 | | 109 AND GREEN ISLAND RD | 2 | | 109 AND VAN METER RD | 2 | | 109 HWY | 2 | | 109N /GREENISLAND RD | 2 | | 114 ROBERTS STREET | 2 | | 1200 CREEK RD AND BUD BENNETT | 2 | | 1200 HWY 109 S | 2 |
|
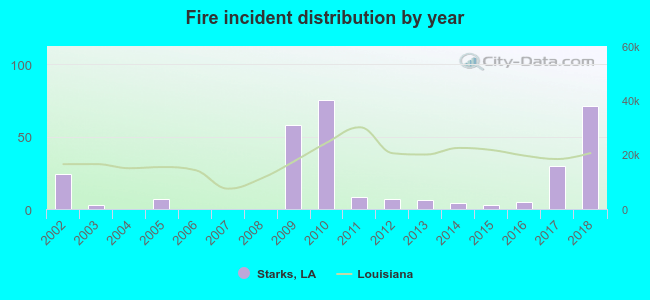 Based on the data from the years 2002 - 2018 the average number of fire incidents per year is 18. The highest number of reported fire incidents - 75 took place in 2010, and the least - 0 in 2004. The data has a rising trend.
 26.9% incidents where reported in the morning and 73.1% in the evening. The most fires (21.3%) took place on Saturday, and the least (11.3%) on Wednesday.
 According to the 301 reports from years 2002 - 2018 most fires (17.6%) took place during January, and the least (2.0%) in December.
 Out of all 440 cases reported during the years 2002 - 2018, the most belonged to the categories: Fire (68.4%), Overpressure Rupture (19.8%), and Rescue & EMS (5.0%).
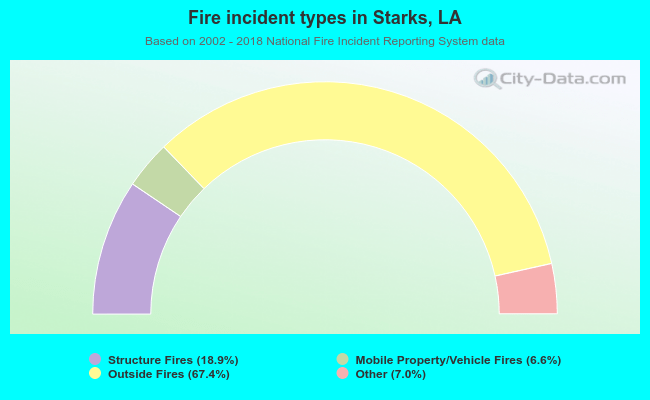 When looking into fire subcategories, the most incidents belonged to: Outside Fires (67.4%), and Structure Fires (18.9%).