State College: Fire Incidents, Pennsylvania (PA)
Where are fire incidents reported in State College, PA
Something went wrong! Please refresh the page.
| Fire incidents reported | |
|---|---|
| Sreet name | Count |
| COLLEGE AVE | 238 |
| BEAVER AVE | 218 |
| ATHERTON ST | 188 |
| VAIRO BLVD | 76 |
| WAUPELANI DR | 66 |
| PUGH ST | 58 |
| FAIRMOUNT AVE | 52 |
| ALLEN ST | 46 |
| CALDER WAY | 42 |
| GARNER ST | 42 |
| PROSPECT AVE | 42 |
| BLUE COURSE DR | 38 |
| AARON DR | 36 |
| COLONNADE WAY | 34 |
| HAMILTON AVE | 32 |
| COLLEGE | 26 |
| FOSTER AVE | 24 |
| TOFTREES AVE | 24 |
| BENNER PIKE | 22 |
| BURROWES ST | 22 |
| LOCUST LN | 22 |
| BARNARD ST | 20 |
| BELLAIRE AVE | 20 |
| HIGHLAND AVE | 20 |
| SOUTHGATE DR | 20 |
| UNIVERSITY DR | 20 |
| FRASER ST | 18 |
| MCCORMICK AVE | 18 |
| NITTANY AVE | 18 |
| PLAZA DR | 18 |
2003 - 2018 National Fire Incident Reporting System (NFIRS) incidents
- Incident types reported to NFIRS in State College, PA
- 1,39224.2%Fire
- 1,33923.3%False Alarm
- 1,27822.2%Good Intent Call
- 1,02317.8%Hazardous Condition
- 3285.7%Service Call
- 2804.9%Rescue & EMS
- 530.9%Special Incident
- 410.7%Overpressure Rupture
- 210.4%Severe Weather
- Fire incident types reported to NFIRS in State College, PA
- 79957.4%Structure Fires
- 32823.6%Outside Fires
- 13910.0%Mobile Property/Vehicle Fires
- 1269.1%Other
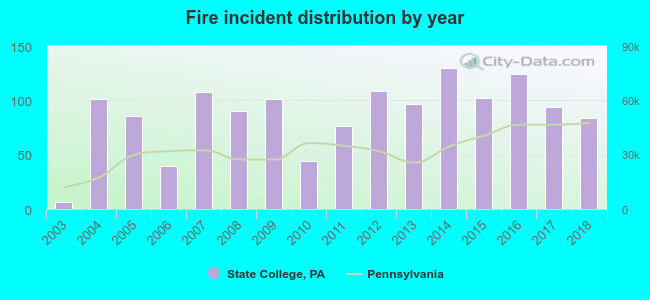 According to the data from the years 2003 - 2018 the average number of fires per year is 87. The highest number of reported fire incidents - 130 took place in 2014, and the least - 6 in 2003. The data has an increasing trend.
The average number of yearly fire incidents per 10k residents in State College, PA compared to nearest cities:
(Note: Based on data for the last 3 years, including only cities with population 5,000 and above)
| State College: | 23.9 |
| Bellefonte: | 29.4 |
| Lewistown: | 139.0 |
| Tyrone: | 77.4 |
| Huntingdon: | 28.9 |
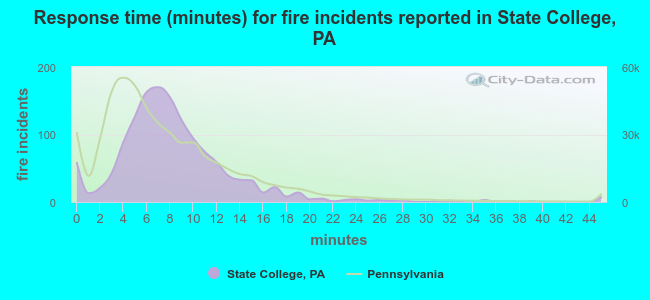 The median response time based on all reported fire incidents is 8 minutes. This is higher than the Pennsylvania median value.
The median response time in State College, PA compared to nearest cities:
(Note: Based on data for all years, including only cities with at least 500 fire incidents)
| State College: | 8 minutes |
| Bellefonte: | 10 minutes |
| Lewistown: | 8 minutes |
| Huntingdon: | 9 minutes |
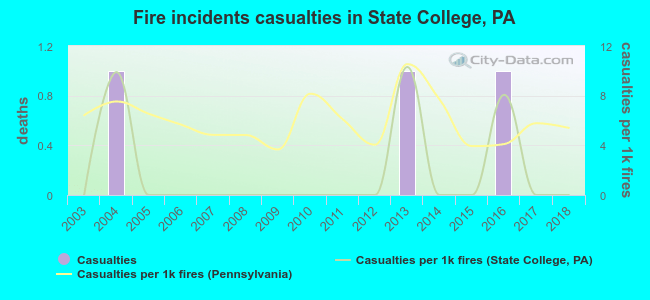 Based on the reports from the years 2003 - 2018 the average number of fire-related yearly casualties is 0. The highest number of injuries - 1 took place in 2004, and the lowest - 0 in 2003. The data has a constant trend.
The average number of casualties per 1,000 fire incidents is 2. This indicator was the highest - 10 in 2013, and the lowest 0 in 2003. The trend for casualties per 1,000 incidents is constant. Compared to the state value the number of casualties per 1,000 fire incidents is much lower.
Based on the reports from the years 2003 - 2018 the average number of fire-related yearly casualties is 0. The highest number of injuries - 1 took place in 2004, and the lowest - 0 in 2003. The data has a constant trend.
The average number of casualties per 1,000 fire incidents is 2. This indicator was the highest - 10 in 2013, and the lowest 0 in 2003. The trend for casualties per 1,000 incidents is constant. Compared to the state value the number of casualties per 1,000 fire incidents is much lower.Casualties per 1,000 incidents in State College, PA compared to nearest cities:
(Note: Based on data for all years, including only cities with at least 500 fire incidents)
| State College: | 2.2 |
| Bellefonte: | 1.8 |
| Lewistown: | 0.8 |
| Huntingdon: | 1.9 |
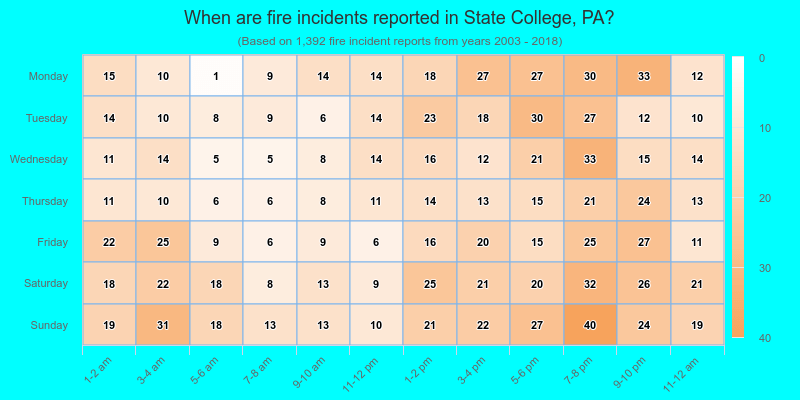
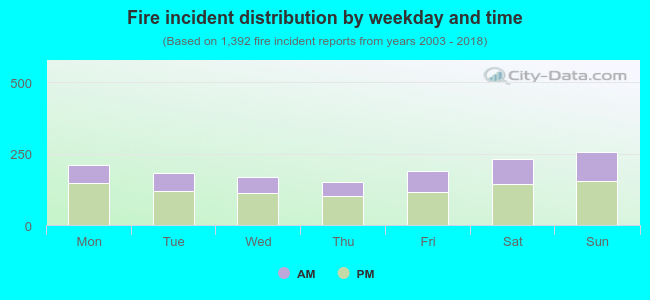 36.1% incidents where reported in the morning and 63.9% in the evening. The most fires (18.5%) took place on Sunday, and the least (10.9%) on Thursday.
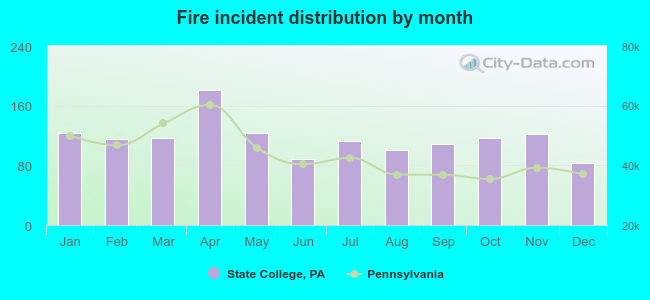 Based on the 1,392 fires from years 2003 - 2018 most fires (13.0%) took place during April, and the least (6.0%) in December.
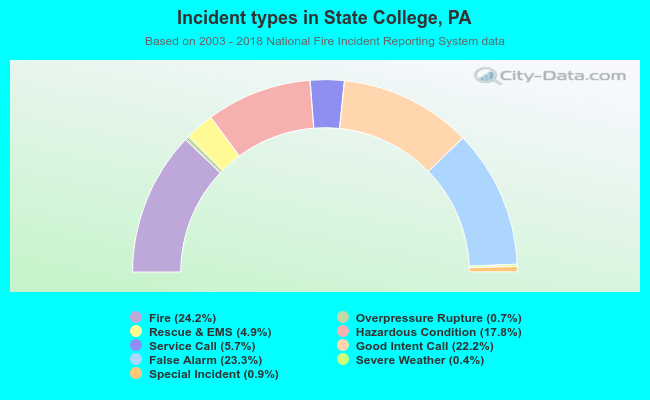 Out of all 5,755 cases reported during the years 2003 - 2018, the most belonged to the categories: Fire (24.2%), False Alarm (23.3%), and Good Intent Call (22.2%).
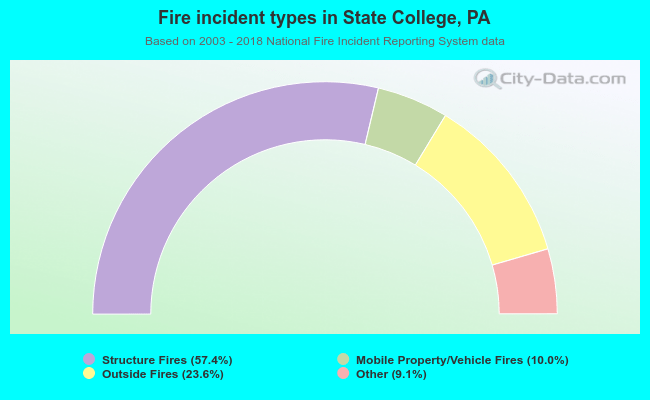 When looking into fire subcategories, the most reports belonged to: Structure Fires (57.4%), and Outside Fires (23.6%).