Ste. Genevieve: Fire Incidents, Missouri (MO)
Where are fire incidents reported in Ste. Genevieve, MO
Something went wrong! Please refresh the page.
|
| |||||||||||||||||||||||||||||||||||||||||||||||||||||||||||||||||||||||||||||||||||||||||||||||||||||||||||||
| Other | 39 | |||||||||||||||||||||||||||||||||||||||||||||||||||||||||||||||||||||||||||||||||||||||||||||||||||||||||||||
2002 - 2011 National Fire Incident Reporting System (NFIRS) incidents
- Incident types reported to NFIRS in Ste. Genevieve, MO
- 48559.8%Fire
- 11313.9%Hazardous Condition
- 789.6%Rescue & EMS
- 597.3%False Alarm
- 506.2%Good Intent Call
- 212.6%Service Call
- 40.5%Overpressure Rupture
- 10.1%Special Incident
- Fire incident types reported to NFIRS in Ste. Genevieve, MO
- 20642.5%Outside Fires
- 19339.8%Structure Fires
- 6713.8%Mobile Property/Vehicle Fires
- 193.9%Other
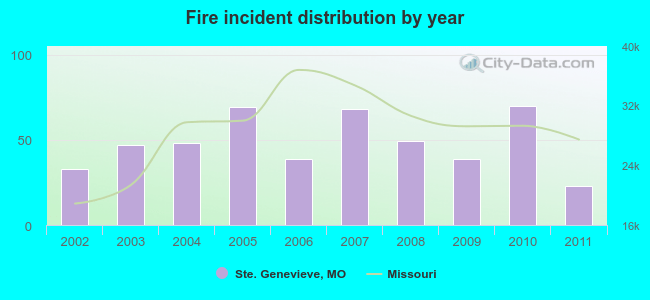 Based on the data from the years 2002 - 2011 the average number of fire incidents per year is 49. The highest number of fire incidents - 70 took place in 2010, and the least - 23 in 2011. The data has a declining trend.
 According to the data from the years 2002 - 2011 the average number of fire-related casualties per year is 1. The highest number of casualties - 2 took place in 2007, and the lowest - 0 in 2006. The data has a constant trend.
 28.0% incidents where reported in the morning and 72.0% in the evening. The most fires (17.5%) took place on Saturday, and the least (12.6%) on Tuesday.
 Based on the 485 reports from years 2002 - 2011 most fires (14.8%) took place during March, and the least (3.9%) in May.
 Out of all 811 cases reported during the years 2002 - 2011, the most belonged to the categories: Fire (59.8%), Hazardous Condition (13.9%), and Rescue & EMS (9.6%).
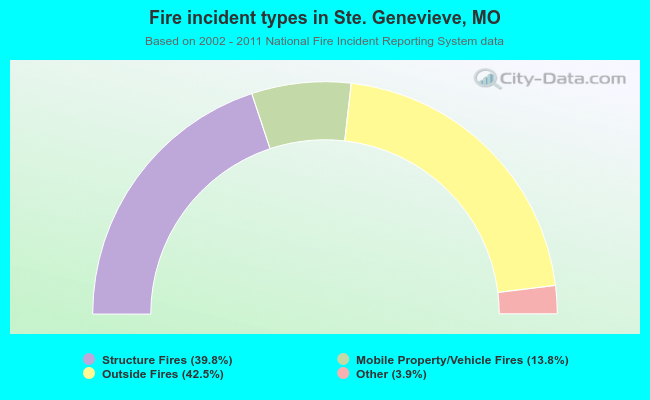 When looking into fire subcategories, the most reports belonged to: Outside Fires (42.5%), and Structure Fires (39.8%).