| Fire incidents reported |
|---|
| Sreet name | Count |
|---|
| HWY 79 SOUTH | 20 | | OUACHITA 2 | 12 | | OUACHITA 5 | 12 | | HWY 79 | 8 | | OUACHITA 8 | 8 | | OUACHITA COUNTY ROAD 5 | 8 | | US HWY 79 | 8 | | 1231 N. 1ST | 6 | | 479 N. CANNON | 6 | | 660 OUACHITA 54 | 6 | | COLUMBIA ROAD 111 RD | 6 | | COLUMBIA ROAD 64 RD | 6 | | HWY 57 | 6 | | HWY 57 N | 6 | | HWY 57 NORTH | 6 | | OUACHITA 1 | 6 | | OUACHITA 120 | 6 | | 141 CAULDWELL HILL RD. | 4 | | 1797 N. 1ST | 4 | | 306 OUACHITA 8 | 4 | | BELLAFONTE | 4 | | CANNON | 4 | | COLUMBIA 73 | 4 | | FIRST ST | 4 | | FIRST ST | 4 |
| | | Fire incidents reported |
|---|
| Sreet name | Count |
|---|
| HIGHWAY 79 NORTH | 4 | | HWY 57 SOUTH | 4 | | HWY 79 HWY | 4 | | NEVADA ROAD 179 | 4 | | OUACHITA 102 | 4 | | OUACHITA 104 | 4 | | OUACHITA 105 | 4 | | OUACHITA 106 | 4 | | OUACHITA 109 | 4 | | OUACHITA 114 | 4 | | OUACHITA 4 | 4 | | OUACHITA 81 | 4 | | RICHLAND | 4 | | RUBY | 4 | | TIDWELL ST | 4 | | U.S. 79 | 4 | | US HWY 79 SOUTH | 4 | | 101 CURRYFIELD RD | 2 | | 101 N 1ST STREEET | 2 | | 101 ROSE TERRACE | 2 | | 103 E. CHERT STREET | 2 | | 103 E.CHERT | 2 | | 105 KENNEDY ST | 2 | | 105 OUA 101 | 2 | | 109 ROSE TERRACE | 2 |
|
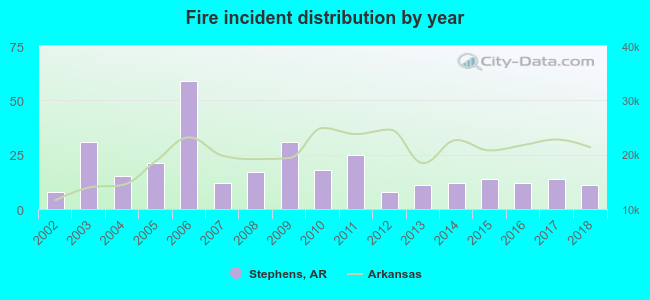 According to the data from the years 2002 - 2018 the average number of fires per year is 19. The highest number of fire incidents - 59 took place in 2006, and the least - 8 in 2002. The data has a growing trend.
 29.5% incidents where reported in the morning and 70.5% in the evening. The most fires (17.9%) took place on Saturday, and the least (11.0%) on Friday.
 According to the 319 fire incidents from years 2002 - 2018 most fires (13.5%) took place during March, and the least (5.3%) in November.
 Out of all 369 cases reported during the years 2002 - 2018, the most belonged to the categories: Fire (86.4%), Rescue & EMS (7.9%), and Service Call (3.0%).
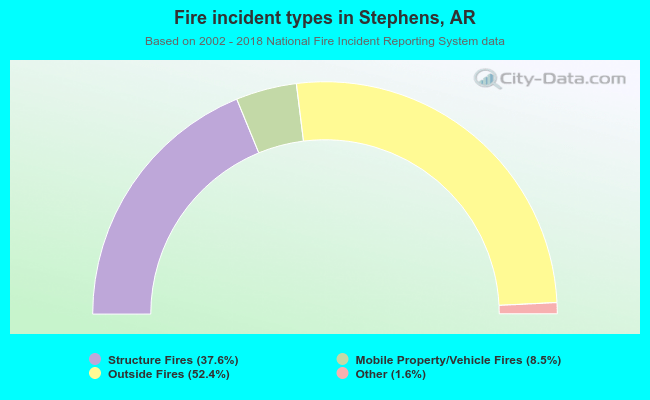 When looking into fire subcategories, the most reports belonged to: Outside Fires (52.4%), and Structure Fires (37.6%).