Sterling: Fire Incidents, Kansas (KS)
Where are fire incidents reported in Sterling, KS
Something went wrong! Please refresh the page.
|
| |||||||||||||||||||||||||||||||||||||||||||||||||||||||||||||||||||||||||||||||||||||||||||||||||||||||||||||
2002 - 2018 National Fire Incident Reporting System (NFIRS) incidents
- Incident types reported to NFIRS in Sterling, KS
- 29485.0%Fire
- 174.9%Rescue & EMS
- 164.6%Good Intent Call
- 113.2%Hazardous Condition
- 30.9%Service Call
- 30.9%False Alarm
- 20.6%Overpressure Rupture
- Fire incident types reported to NFIRS in Sterling, KS
- 21372.4%Outside Fires
- 5217.7%Structure Fires
- 206.8%Mobile Property/Vehicle Fires
- 93.1%Other
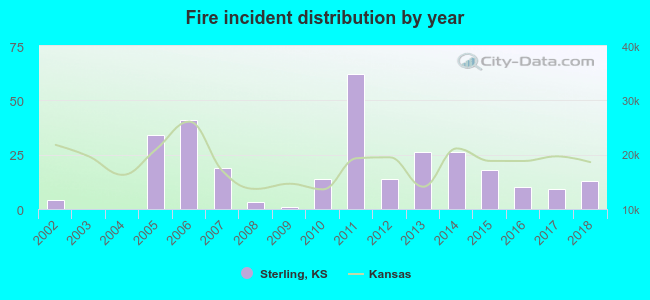 Based on the data from the years 2002 - 2018 the average number of fires per year is 17. The highest number of fires - 62 took place in 2011, and the least - 0 in 2003. The data has a growing trend.
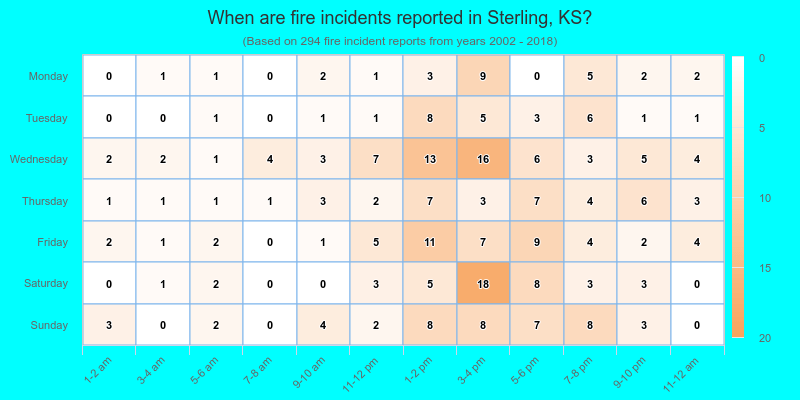
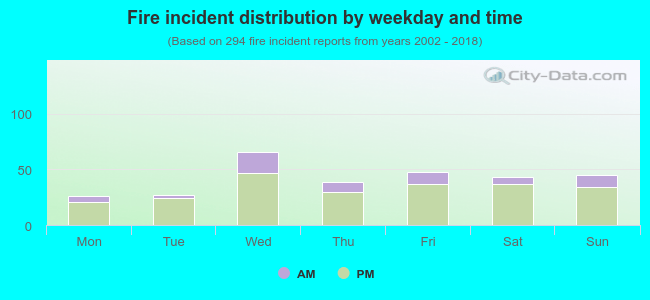 21.8% incidents where reported in the morning and 78.2% in the evening. The most fires (22.4%) took place on Wednesday, and the least (8.8%) on Monday.
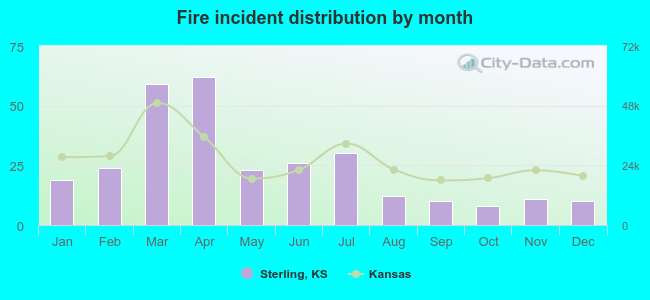 Based on the 294 reports from years 2002 - 2018 most fires (21.1%) took place during April, and the least (2.7%) in October.
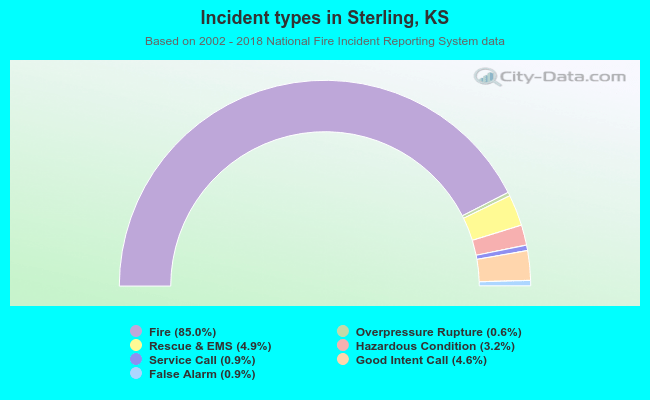 Out of all 346 cases reported during the years 2002 - 2018, the most belonged to the categories: Fire (85.0%), Rescue & EMS (4.9%), and Good Intent Call (4.6%).
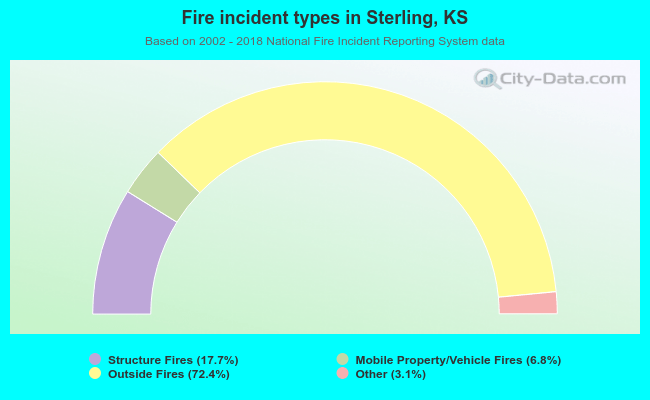 When looking into fire subcategories, the most incidents belonged to: Outside Fires (72.4%), and Structure Fires (17.7%).