Sterling: Fire Incidents, Ohio (OH)
Where are fire incidents reported in Sterling, OH
Something went wrong! Please refresh the page.
|
| |||||||||||||||||||||||||||||||||||||||||||||||||||||||||||||||||||||||||||||||||||||||||||||||||||||||||||||
2002 - 2018 National Fire Incident Reporting System (NFIRS) incidents
- Incident types reported to NFIRS in Sterling, OH
- 25241.3%Rescue & EMS
- 19031.1%Fire
- 508.2%Service Call
- 477.7%Hazardous Condition
- 447.2%Good Intent Call
- 243.9%False Alarm
- 20.3%Severe Weather
- 10.2%Overpressure Rupture
- Fire incident types reported to NFIRS in Sterling, OH
- 8745.8%Structure Fires
- 8645.3%Outside Fires
- 168.4%Mobile Property/Vehicle Fires
- 10.5%Other
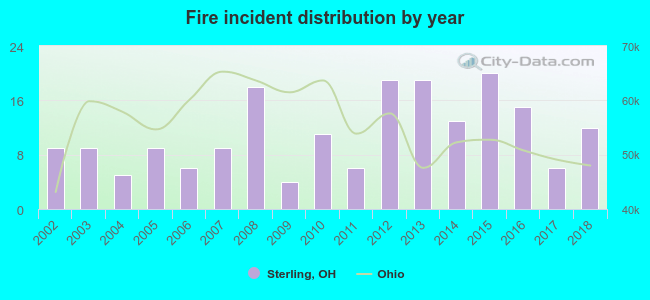 According to the data from the years 2002 - 2018 the average number of fire incidents per year is 11. The highest number of reported fire incidents - 20 took place in 2015, and the least - 4 in 2009. The data has an increasing trend.
 24.7% incidents where reported in the morning and 75.3% in the evening. The most fires (23.2%) took place on Saturday, and the least (8.4%) on Tuesday.
 According to the 190 fires from years 2002 - 2018 most fires (14.2%) took place during July, and the least (2.6%) in January.
 Out of all 610 cases reported during the years 2002 - 2018, the most belonged to the categories: Rescue & EMS (41.3%), Fire (31.1%), and Service Call (8.2%).
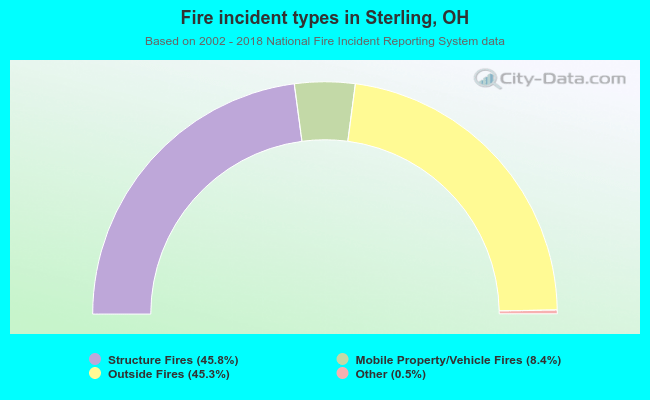 When looking into fire subcategories, the most incidents belonged to: Structure Fires (45.8%), and Outside Fires (45.3%).