| Fire incidents reported |
|---|
| Sreet name | Count |
|---|
| RED ARROW HWY | 36 | | JOHN BEERS RD | 24 | | I-94 HWY | 16 | | RIDGE RD | 16 | | CLEVELAND AVE | 12 | | JOHNSON RD | 12 | | HOLLYWOOD RD | 10 | | MARQUETTE WOODS RD | 10 | | 5019 RED ARROW HWY | 8 | | HOLDEN RD | 8 | | 4363 WEST VELVET ST | 6 | | 4581 REDARROW HWY | 6 | | 604 WEST JOHN BEERS RD | 6 | | 604 WEST JOHNBEERS RD | 6 | | GLENLORD RD | 6 | | LARA LN | 6 | | RELIABLE PATH | 6 | | ROOSEVELT RD | 6 | | STEVENSVILLE-BARODA RD | 6 | | 2230 JOHNBEERS | 4 | | 4150 RIDGE RD | 4 | | 4672 CHICAGO AVE | 4 | | 5275 REDARROW HWY | 4 | | 5601 EAST KAREN CT | 4 | | 604 W JOHN BEERS RD | 4 |
| | | Fire incidents reported |
|---|
| Sreet name | Count |
|---|
| 7050 JERICHO RD | 4 | | ALPINE RIDGE RD | 4 | | CARDINAL DR | 4 | | I94/22MILEMARKER HWY | 4 | | I94/23 MILE MARKER HWY | 4 | | LAWRENCE ST | 4 | | LINCO RD | 4 | | PEACH ST | 4 | | ROCKEYWEED RD | 4 | | ST. JOSEPH AVE | 4 | | !94/22MILEMARKER HWY | 2 | | 10790 DATE RD | 2 | | 1088 WEST JOHNBEERS RD | 2 | | 1153 GLENLORD LOT 25 | 2 | | 1167 ROCKEY WEED RD | 2 | | 1315 DEERFIELD RD | 2 | | 1359 GLENLORD | 2 | | 1391 FRUITWOOD ST | 2 | | 1423 ST JOSEPH CIRCLE | 2 | | 1485 BRENTWOOD | 2 | | 1489 OLDFARM LN | 2 | | 1505 CARDINAL DR | 2 | | 1515 CARDINAL DR | 2 | | 1542 SOUTH CHERRY DRIV | 2 | | 1543 LUPINE RD | 2 |
|
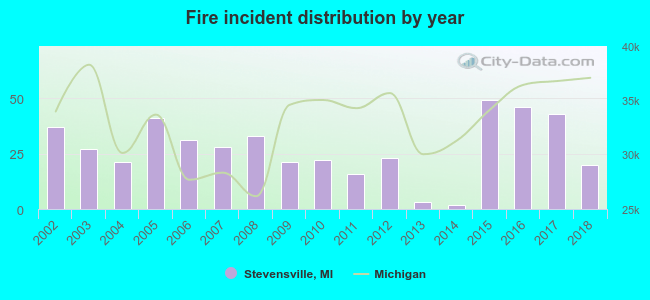 Based on the data from the years 2002 - 2018 the average number of fires per year is 27. The highest number of fires - 49 took place in 2015, and the least - 2 in 2014. The data has a decreasing trend.
 32.0% incidents where reported in the morning and 68.0% in the evening. The most fires (16.8%) took place on Saturday, and the least (9.7%) on Friday.
 Based on the 463 fires from years 2002 - 2018 most fires (12.1%) took place during November, and the least (5.2%) in September.
 Out of all 1,946 cases reported during the years 2002 - 2018, the most belonged to the categories: Hazardous Condition (39.3%), Fire (23.8%), and False Alarm (11.9%).
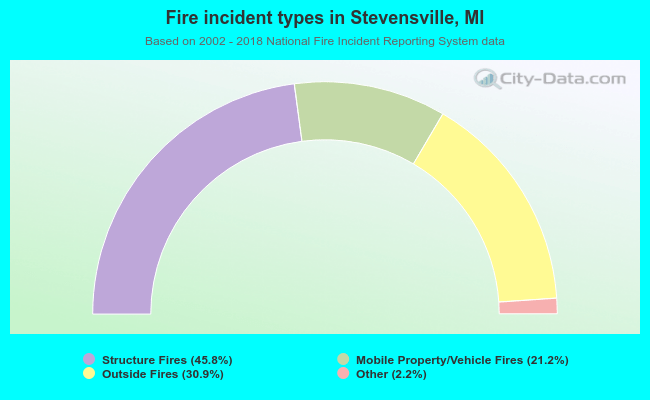 When looking into fire subcategories, the most incidents belonged to: Structure Fires (45.8%), and Outside Fires (30.9%).