Stilesville: Fire Incidents, Indiana (IN)
Where are fire incidents reported in Stilesville, IN
Something went wrong! Please refresh the page.
|
| |||||||||||||||||||||||||||||||||||||||||||||||||||||||||||||||||||||||||||||||||||||||||||||||||||||||||||||
2002 - 2018 National Fire Incident Reporting System (NFIRS) incidents
- Incident types reported to NFIRS in Stilesville, IN
- 36241.4%Rescue & EMS
- 35440.5%Fire
- 10512.0%Good Intent Call
- 232.6%Hazardous Condition
- 202.3%Service Call
- 80.9%False Alarm
- 20.2%Special Incident
- 10.1%Severe Weather
- Fire incident types reported to NFIRS in Stilesville, IN
- 17048.0%Outside Fires
- 10028.2%Structure Fires
- 5214.7%Other
- 329.0%Mobile Property/Vehicle Fires
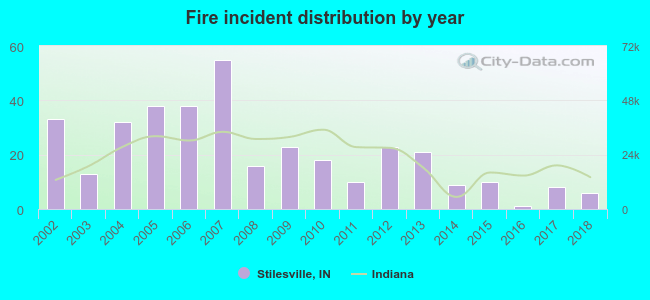 Based on the data from the years 2002 - 2018 the average number of fires per year is 21. The highest number of fire incidents - 55 took place in 2007, and the least - 1 in 2016. The data has a dropping trend.
 21.5% incidents where reported in the morning and 78.5% in the evening. The most fires (20.6%) took place on Saturday, and the least (10.7%) on Friday.
 According to the 354 fire incidents from years 2002 - 2018 most fires (16.9%) took place during March, and the least (3.4%) in August.
 Out of all 875 cases reported during the years 2002 - 2018, the most belonged to the categories: Overpressure Rupture (41.4%), Fire (40.5%), and Service Call (12.0%).
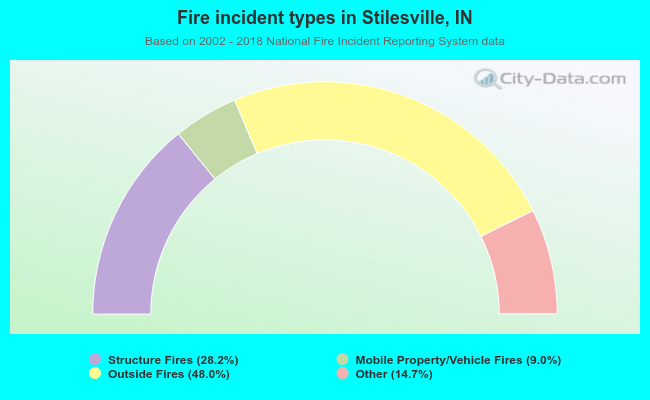 When looking into fire subcategories, the most incidents belonged to: Outside Fires (48.0%), and Structure Fires (28.2%).