Stockbridge: Fire Incidents, Michigan (MI)
Where are fire incidents reported in Stockbridge, MI
Something went wrong! Please refresh the page.
|
| |||||||||||||||||||||||||||||||||||||||||||||||||||||||||||||||||||||||||||||||||||||||||||||||||||||||||||||
2002 - 2018 National Fire Incident Reporting System (NFIRS) incidents
- Incident types reported to NFIRS in Stockbridge, MI
- 47245.0%Fire
- 19318.4%Hazardous Condition
- 15114.4%Rescue & EMS
- 999.4%Good Intent Call
- 949.0%Service Call
- 212.0%False Alarm
- 121.1%Special Incident
- 30.3%Overpressure Rupture
- 30.3%Severe Weather
- Fire incident types reported to NFIRS in Stockbridge, MI
- 24251.3%Structure Fires
- 16434.7%Outside Fires
- 5010.6%Mobile Property/Vehicle Fires
- 163.4%Other
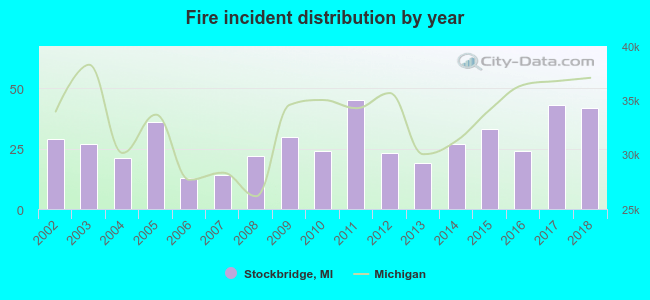 Based on the data from the years 2002 - 2018 the average number of fires per year is 28. The highest number of fires - 45 took place in 2011, and the least - 13 in 2006. The data has an increasing trend.
 28.6% incidents where reported in the morning and 71.4% in the evening. The most fires (16.1%) took place on Friday, and the least (12.5%) on Thursday.
 Based on the 472 fires from years 2002 - 2018 most fires (22.5%) took place during April, and the least (4.2%) in February.
 Out of all 1,048 cases reported during the years 2002 - 2018, the most belonged to the categories: Fire (45.0%), Hazardous Condition (18.4%), and Rescue & EMS (14.4%).
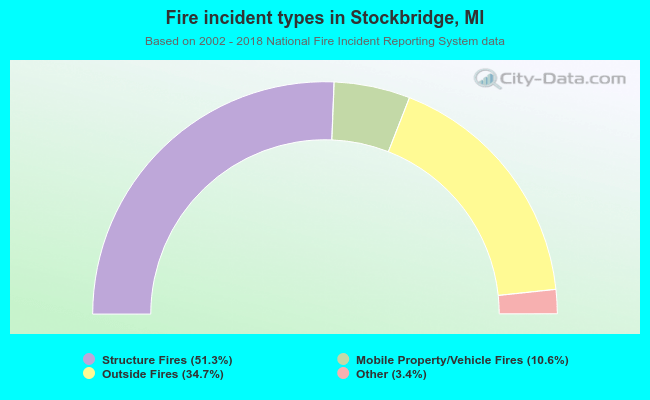 When looking into fire subcategories, the most incidents belonged to: Structure Fires (51.3%), and Outside Fires (34.7%).