Stoneham: Fire Incidents, Massachusetts (MA)
Where are fire incidents reported in Stoneham, MA
Something went wrong! Please refresh the page.
| Fire incidents reported | |
|---|---|
| Sreet name | Count |
| MAIN ST | 462 |
| EXCEPTION | 148 |
| FRANKLIN ST | 104 |
| MOUNTAIN VIEW DRIVE | 78 |
| MONTVALE AVE | 72 |
| HILL ST | 60 |
| DUNCKLEE AVE | 58 |
| CENTRAL ST | 50 |
| NORTH ST | 42 |
| PARKER CHASE RD | 36 |
| CALTHEA ST | 34 |
| MARBLE ST | 34 |
| COLONIAL COURT | 32 |
| MAIN ST | 32 |
| POMEWORTH ST | 32 |
| WOODLAND RD | 32 |
| FELLSWAY WEST | 24 |
| PARK ST | 24 |
| POND ST | 22 |
| LEISURE LANE | 20 |
| WILLIAM ST | 20 |
| I93N | 18 |
| MUTUAL AID TO STONEHAM | 18 |
| PARK TERRACE DRIVE | 18 |
| PLEASANT ST | 18 |
| STONEHILL DRIVE | 18 |
| MAPLE ST | 16 |
| ELM ST | 14 |
| MONTVALE AVE | 12 |
| PINE ST | 12 |
2002 - 2018 National Fire Incident Reporting System (NFIRS) incidents
- Incident types reported to NFIRS in Stoneham, MA
- 10,25747.1%Rescue & EMS
- 5,16423.7%Hazardous Condition
- 1,7898.2%Special Incident
- 1,3296.1%Fire
- 1,2255.6%False Alarm
- 1,0744.9%Good Intent Call
- 8884.1%Service Call
- 240.1%Severe Weather
- Fire incident types reported to NFIRS in Stoneham, MA
- 91168.5%Structure Fires
- 19114.4%Outside Fires
- 17012.8%Mobile Property/Vehicle Fires
- 574.3%Other
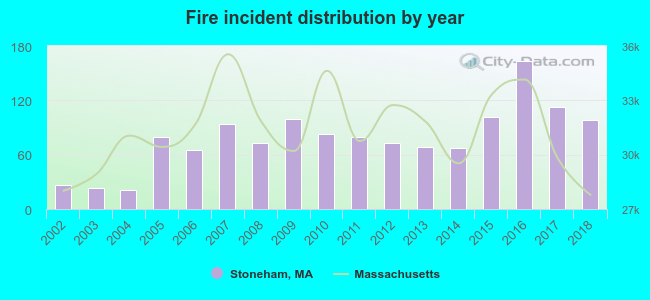 According to the data from the years 2002 - 2018 the average number of fires per year is 78. The highest number of reported fire incidents - 163 took place in 2016, and the least - 21 in 2004. The data has a rising trend.
The average number of yearly fire incidents per 10k residents in Stoneham, MA compared to nearest cities:
(Note: Based on data for the last 3 years, including only cities with population 5,000 and above)
| Stoneham: | 58.2 |
| Wakefield: | 21.3 |
| Melrose: | 6.6 |
| Woburn: | 52.0 |
| Winchester: | 12.9 |
| Reading: | 29.9 |
| Malden: | 22.3 |
| Medford: | 41.3 |
| Saugus: | 48.2 |
 The median response time based on all reported fire incidents is 3 minutes. This is lower than the state median value.
The median response time in Stoneham, MA compared to nearest cities:
(Note: Based on data for all years, including only cities with at least 500 fire incidents)
| Stoneham: | 3 minutes |
| Wakefield: | 2 minutes |
| Woburn: | 4 minutes |
| Winchester: | 4 minutes |
| Reading: | 4 minutes |
| Malden: | 3 minutes |
| Medford: | 3 minutes |
| Saugus: | 5 minutes |
| Lynnfield: | 5 minutes |
 Based on the reports from the years 2002 - 2018 the average number of fire-related yearly casualties is 0. The highest number of reported injuries - 1 took place in 2002, and the lowest - 0 in 2003. The data has a constant trend.
The average number of injuries per 1,000 fires is 7. This indicator was the highest - 48 in 2004, and the lowest 0 in 2003. The trend for injuries per 1,000 fire incidents is dropping. Compared to the state value the number of casualties per 1,000 fires is much lower.
Based on the reports from the years 2002 - 2018 the average number of fire-related yearly casualties is 0. The highest number of reported injuries - 1 took place in 2002, and the lowest - 0 in 2003. The data has a constant trend.
The average number of injuries per 1,000 fires is 7. This indicator was the highest - 48 in 2004, and the lowest 0 in 2003. The trend for injuries per 1,000 fire incidents is dropping. Compared to the state value the number of casualties per 1,000 fires is much lower.
 29.9% incidents where reported in the morning and 70.1% in the evening. The most fires (16.6%) took place on Thursday, and the least (12.4%) on Tuesday.
 Based on the 1,329 fire incidents from years 2002 - 2018 most fires (9.7%) took place during January, and the least (7.1%) in August.
 Out of all 21,762 cases reported during the years 2002 - 2018, the most belonged to the categories: Rescue & EMS (47.1%), Hazardous Condition (23.7%), and Special Incident (8.2%).
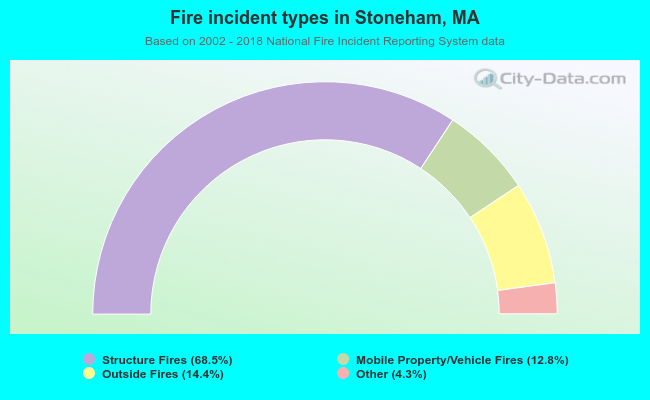 When looking into fire subcategories, the most reports belonged to: Structure Fires (68.5%), and Outside Fires (14.4%).